
GitLab comes with some built-in monitoring and visualization capabilities, such as Cycle Analytics and the per-project contributors and repository graphs, as well as integration with Prometheus to monitor your GitLab instance at the server level. Cycle Analytics is especially useful as it enables teams to analyze their efficiency. However, if you want to analyze the data by searching and querying, or if you want to visualize the data yourself, you might find it helpful to adopt a more centralized methodology by integrating with the ELK Stack (Elasticsearch, Logstash and Kibana).
ELK provides powerful log aggregation, analysis and visualization capabilities that, used in tandem with GitLab’s extensive logging framework, will give organizations an accurate and comprehensive bird's eye view of the system for monitoring, troubleshooting, and analyzing team activity. Using GitLab’s log data, for example, rich dashboards can be created to monitor not only the system’s general health but also specific team metrics, such as the number of commits, issues opened and closed, and so forth.
Logz.io users can benefit from a built-in integration with GitLab and the additional analysis tools provided by the service, but if you’re using your own ELK deployment you’ll be able to set up the described integration as well.
How to integrate GitLab and Logz.io
The steps outlined below presume the following:
- You have an Omnibus GitLab installation up and running. If you haven't installed GitLab already, visit the installation page.
- You have an ELK Stack up and running (either your own ELK deployment or a Logz.io account). We will be using Filebeat to ship the logs into Elasticsearch, so Logstash is only required if you want to apply advanced parsing to the data.
GitLab logs
As mentioned above, GitLab has an advanced logging framework that ships a variety of different system logs.
Of course, what log data you want to ship is entirely up to you. You can ship all the log data, or you can be a bit more selective. These logs can be pretty verbose, so depending on storage and retention considerations, it’s good practice to first understand what logs you need to monitor in the first place.
The Filebeat configurations provided below are designed for shipping the following logs.
production_json.log
This JSON-formatted log records requests sent by GitLab to the Ruby controllers. Here is a sample log:
{"method":"GET","path":"/-/metrics","format":"html","controller":
"MetricsController","action":"index","status":200,"duration":1.69,
"view":0.23,"db":0.0,"time":"2017-12-26T14:47:49.505Z","params":{},
"remote_ip":null,"user_id":null,"username":null}
As you can see, the information in the log includes the request method, the controller, the action performed, the request status, duration, remote IP, and more.
The location of the file will vary according to your installation types. In the case of the Omnibus GitLab packages (recommended installation), the file will reside at:
/var/log/gitlab/gitlab-rails/production_json.log
production.log
This is a plain text log file that contains information about all performed requests. It includes the request URL, type, and origin IP as well the parts of code that serviced it. The log also provides details on all SQL requests and how long they took. Here is a sample log:
Completed 200 OK in 1ms (Views: 0.2ms | ActiveRecord: 3.2ms |
Elasticsearch: 1.5ms)
Again, the location of the file varies. In the case of the GitLab Omnibus packages, the file resides at:
/var/log/gitlab/gitlab-rails/production.log
api_json.log
A specific, JSON-formatted, file for logging API requests only.
{"time":"2017-12-10T18:30:11.219Z","severity":"INFO","duration":5.22,
"db":0.82,"view":10.11,"status":200,"method":"POST","path":"/api/v4/
internal/allowed","params":{"action":"git-upload-pack","changes":"_any","
<span style="font-weight: 400;">project":"hello-world","protocol":"ssh","env":"{}","key_id":"[FILTERED]"
,"secret_token":"[FILTERED]"},"host":"127.0.0.1","ip":"127.0.0.1","ua":"Ruby"}</span>
Location:
/var/log/gitlab/gitlab-rails/api_json.log
application.log
This plain text log file tracks GitLab actions such as adding a new user, creating a new project or group, and so forth. Can act as an audit trail for monitoring user activity.
Example:
December 24, 2017 15:10: User Created: username=dbirtin [email protected]
ip=xx.xx.xxx.xx confirmed:true
Location:
/var/log/gitlab/gitlab-rails/application.log
In any case, I recommend reading GitLab’s excellent documentation to read up on these log files and the information included in them before commencing.
Configuring Filebeat
Filebeat is a log shipper belonging to the Beats family of shippers. Written in Go and extremely lightweight, Filebeat is the easiest and most cost-efficient way of shipping log files into the ELK Stack.
If you haven’t already installed Filebeat, here are some instructions (for Debian):
curl -L -O https://artifacts.elastic.co/downloads/beats/filebeat/filebeat-6.1.1-amd64.deb
sudo dpkg -i filebeat-6.1.1-amd64.deb
Open up the Filebeat configuration file at: /etc/filebeat/filebeat.yml:
sudo vim /etc/filebeat/filebeat.yml
The following configuration defines the different GitLab files to track and ship into ELK. I’ve defined a prospector for each log type so I can add custom fields to each. Alternatively, I could have defined one prospector for all of the files.
filebeat.prospectors:
- type: log
  enabled: true
  paths:
    - /var/log/gitlab/gitlab-rails/production_json.log
  fields:
    log: production_json
  json.keys_under_root: true
- type: log
  enabled: true
  paths:
    - /var/log/gitlab/gitlab-rails/production.log
  fields:
    log: production
- type: log
  enabled: true
  paths:
    - /var/log/gitlab/gitlab-rails/api_json.log
  fields:
    log: api_json
  json.keys_under_root: true
- type: log
  enabled: true
  paths:
    - /var/log/gitlab/gitlab-rails/application.log
  fields:
    log: application
output.elasticsearch:
  # Array of hosts to connect to.
  hosts: ["localhost:9200"]
Start Filebeat with:
sudo service filebeat start
After a while, a new index will be created and you can define a new index pattern (filebeat-*) in Kibana to begin analyzing the data.
Shipping to Logz.io
If you are using Logz.io, a few small modifications need to be applied to establish the logging pipeline.
First, you will need to download an SSL certificate to use encryption:
wget https://raw.githubusercontent.com/logzio/public-certificates/master/COMODORSADomainValidationSecureServerCA.crt

sudo mkdir -p /etc/pki/tls/certs

sudo cp COMODORSADomainValidationSecureServerCA.crt /etc/pki/tls/certs/
You can now edit the Filebeat configuration file. If you like, you can make use of the Logz.io Filebeat wizard to generate the FIlebeat YAML file automatically (available in the Filebeat section, under Log Shipping in the UI).
Either way, the configurations should look something like this:
filebeat:
  prospectors:
    -
      paths:
        - /var/log/gitlab/gitlab-rails/production_json.log
      fields:
        logzio_codec: json
        token: <yourToken>
        type: gitlab-production-json
      fields_under_root: true
      encoding: utf-8
      ignore_older: 3h
    -
      paths:
        - /var/log/gitlab/gitlab-rails/production.log
      fields:
        logzio_codec: plain
        token: <yourToken>
        type: gitlab-production
      fields_under_root: true
      encoding: utf-8
      ignore_older: 3h
    -
      paths:
        - /var/log/gitlab/gitlab-rails/api_json.log
      fields:
        logzio_codec: json
        token: <yourToken>
        type: gitlab-api-json
      fields_under_root: true
      encoding: utf-8
      ignore_older: 3h
    -
      paths:
        - /var/log/gitlab/gitlab-rails/application.log
      fields:
        logzio_codec: plain
        token: <yourToken>
        type: gitlab-application
      fields_under_root: true
      encoding: utf-8
      ignore_older: 3h
  registry_file: /var/lib/filebeat/registry
output:
  logstash:
    hosts: ["listener.logz.io:5015"]
    ssl:
      certificate_authorities: ['/etc/pki/tls/certs/COMODORSADomainValidationSecureServerCA.crt']
The main differences are:
- Logz.io specific fields added to each prospector. Replace
with your Logz.io account token (can be found in the Logz.io UI, under Settings). - The output section defines the Logz.io listener and the SSL certificate to use.
Once you start (or restart) Filebeat, the GitLab logs will begin to show up in Logz.io.
Analyzing the GitLab logs
Now that your logging pipeline is up and running, it’s time to look into the data with some simple analysis operations in Kibana.
Some of the fields can be used to get some visibility into the logs. Adding, for example, the ‘type’ field (the ‘log’ field in case you are using your own ELK), helps give the logs some context.
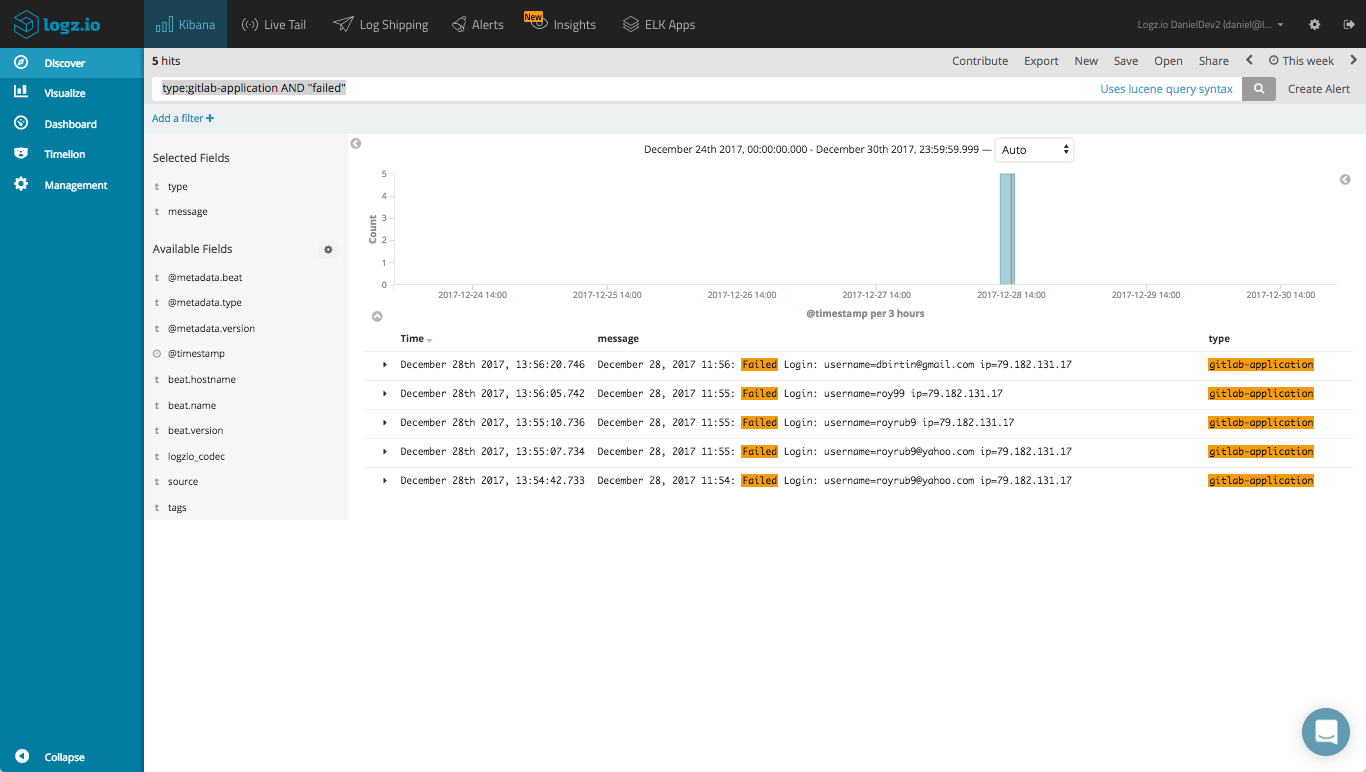
We can use Kibana queries to search for specific log data. Say, for example, you want to take a look at failed logins into the system. To do this, we would use this combination of a field-level and free-text search:
type:gitlab-application AND "failed"
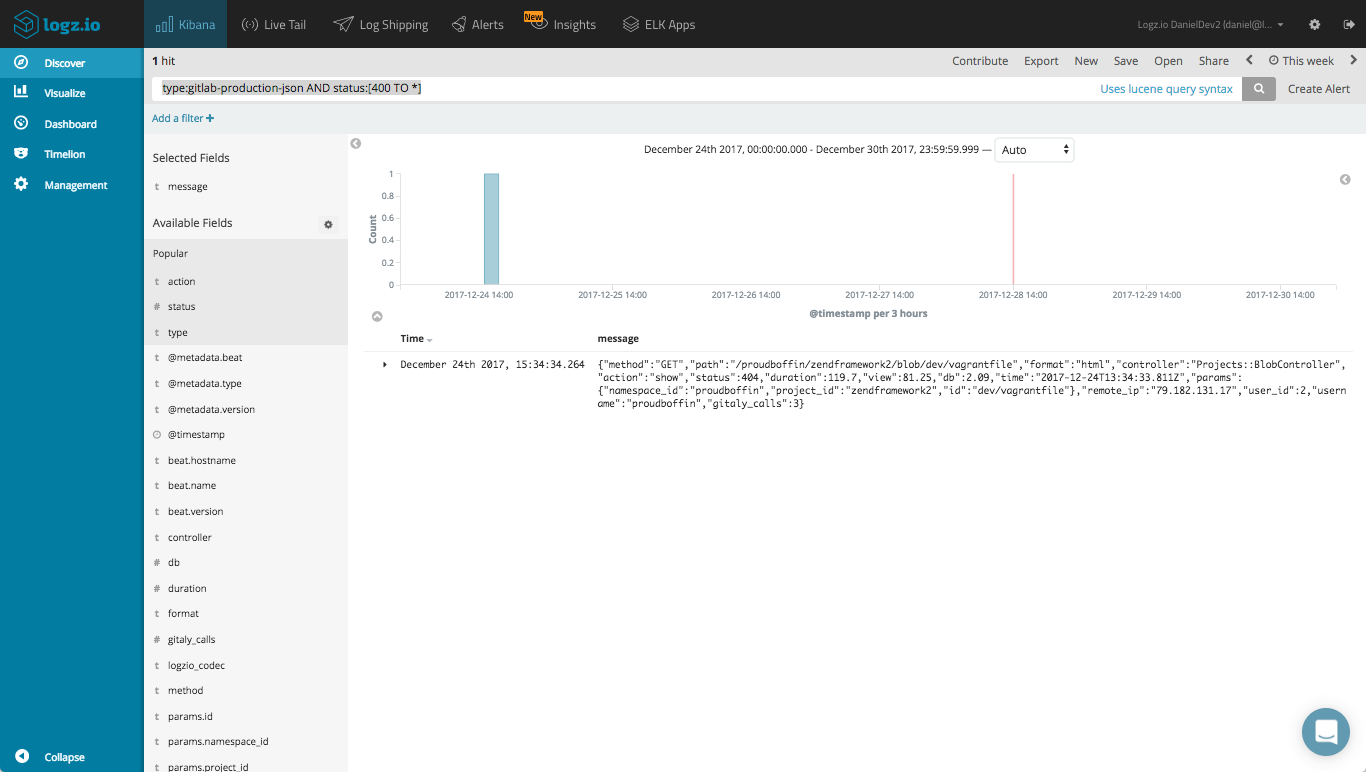
Another example could be querying Elasticsearch for error responses for GitLab requests:
type:gitlab-production-json AND status:[400 TO *]
Using Kibana’s visualization capabilities, you can create a series of simple charts and metric visualizations for giving you a nice overview of your GitLab environment. Here are a few examples.
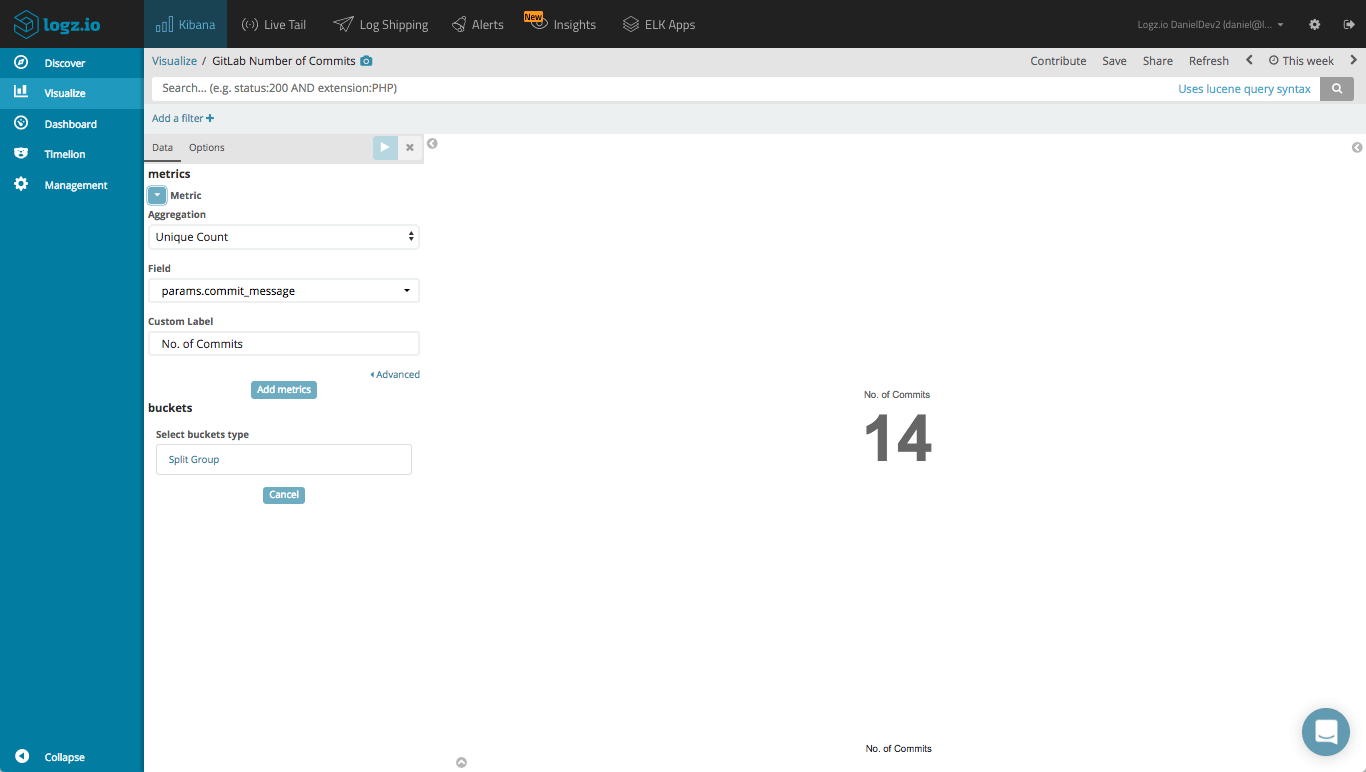
Visualizing commits
What organization does not want to monitor its team’s productivity? A simple metric visualization will give you a counter on how many commits were performed by your team:
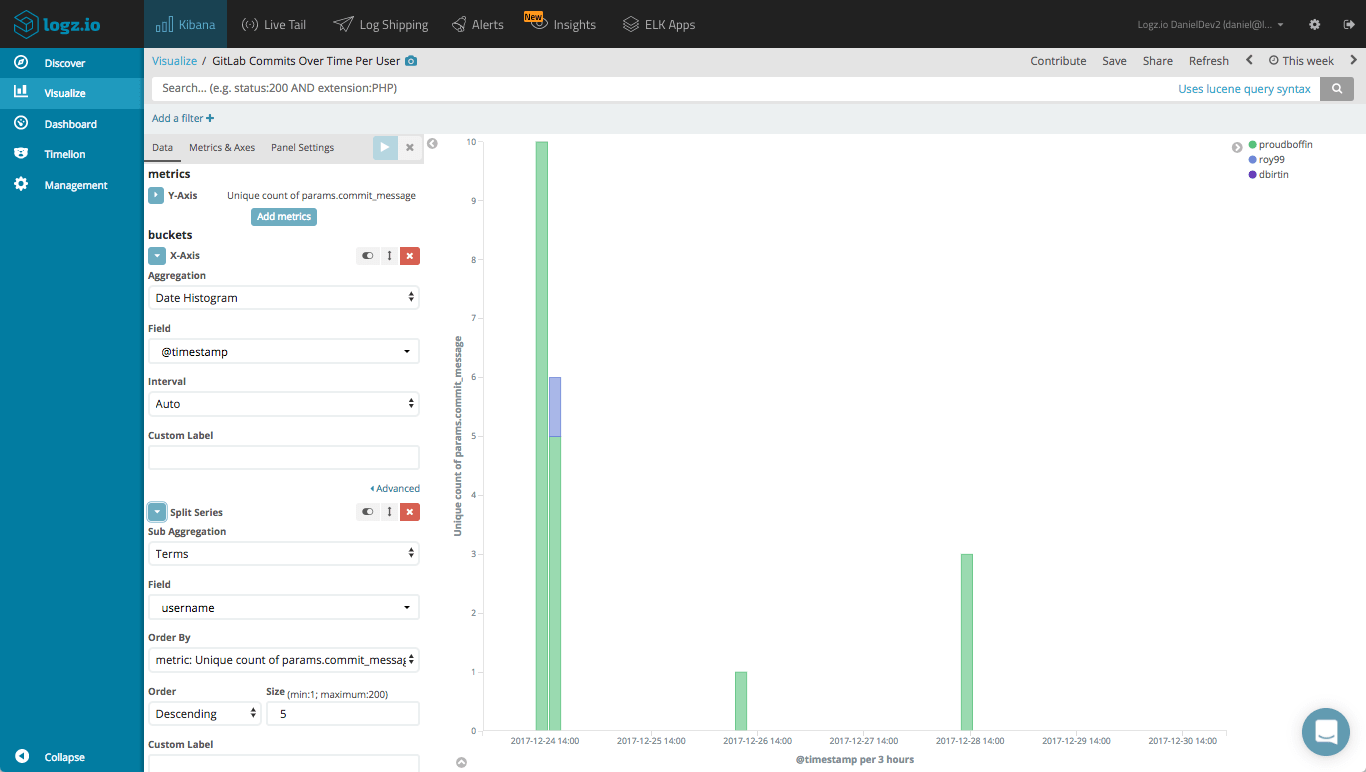
Likewise, we can create a line chart visualization that gives us an overview over time of the commits, per user:
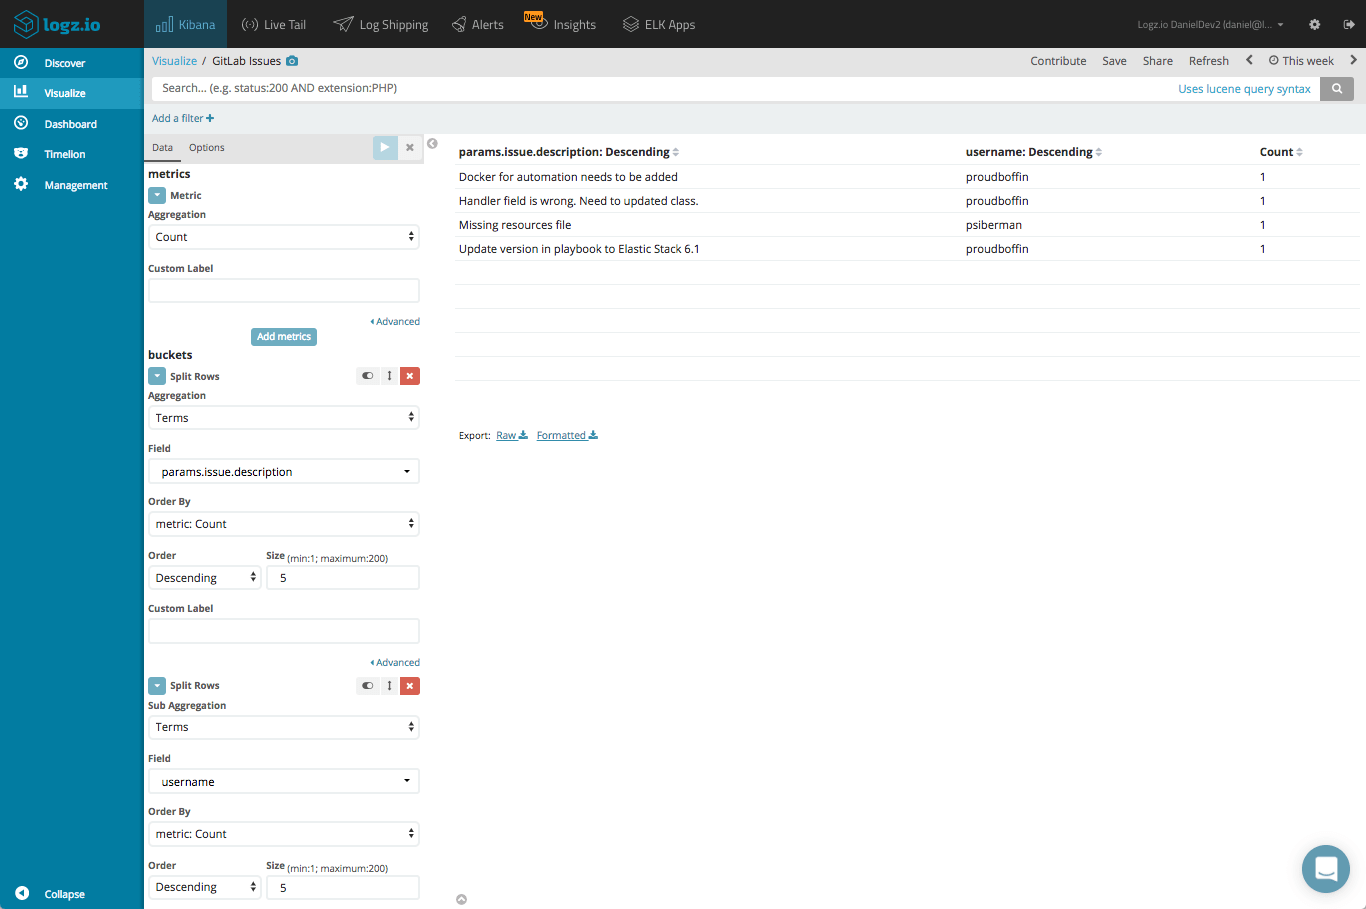
Visualizing issues
In a similar fashion, you can use Kibana to keep track of opened and closed issues. A simple data table visualization gives us a breakdown of the issues opened:
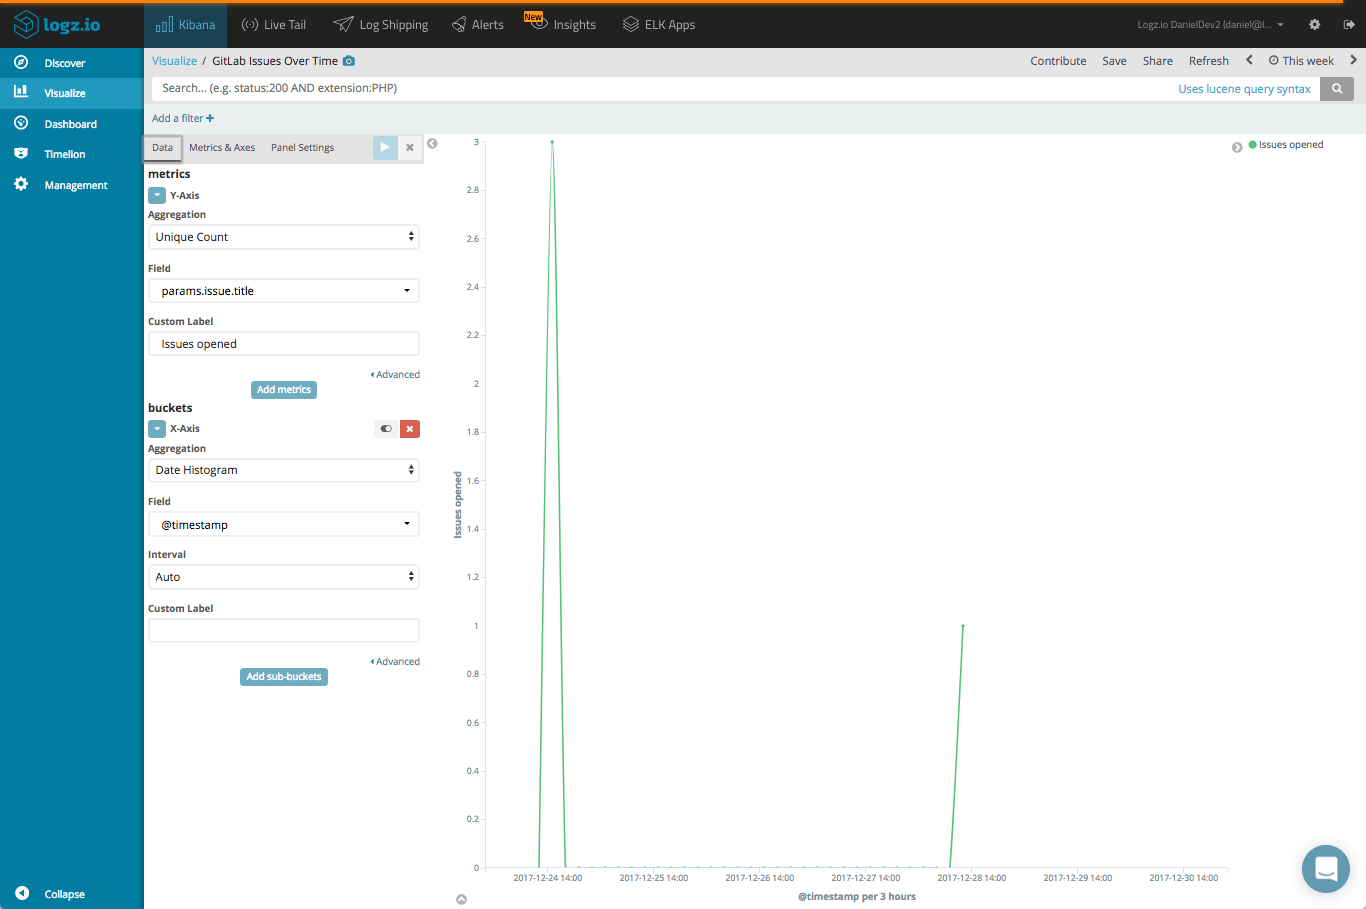
A line chart can give us a depiction of how many issues were opened over time:
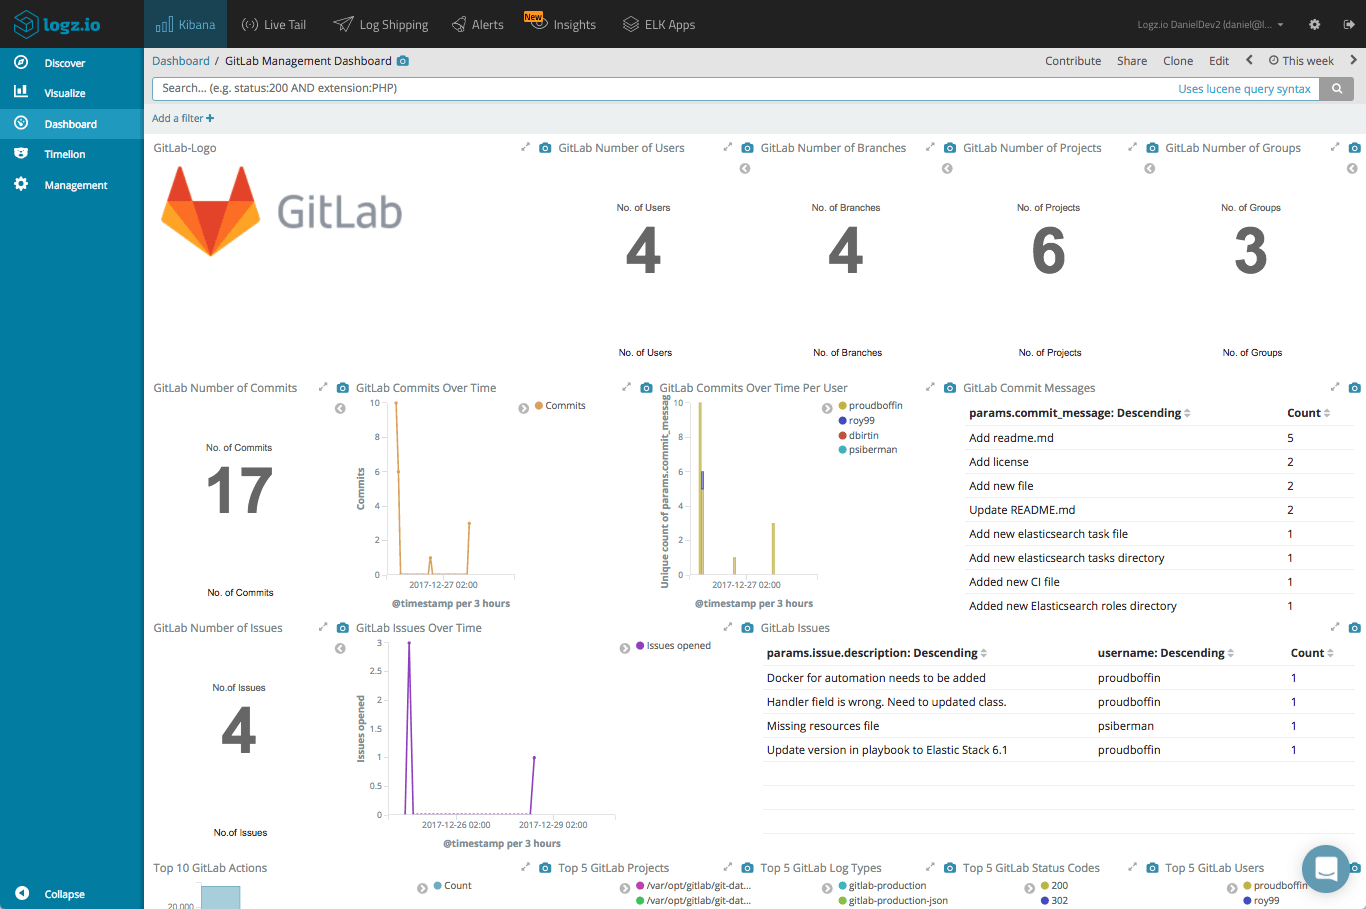
The list goes on. You can monitor projects created, merges, user activity, CI/CD processes, and more. The logs generated by GitLab include a wealth of information that can be tapped into for monitoring, and adding these visualizations into one Kibana dashboard gives you a nice overview of your environment.
End notes
The ELK Stack offers built-in storage, search and visualization features that complement GitLab’s rich logging capabilities. Using Filebeat, building a logging pipeline for shipping data into ELK is simple. If you want to further process the logs, you might want to consider adding Logstash into your pipeline setup.
Logz.io provides some tools to help you hit the ground running – easy integration steps, as well as the monitoring dashboard above. To install the dashboard, simply search for ‘GitLab’ in ELK Apps and hit the install button.
Enjoy!
About the guest author
Daniel Berman is Product Evangelist at Logz.io. He is passionate about log analytics, big data, cloud, and family and loves running, Liverpool FC, and writing about disruptive tech stuff. Follow him @proudboffin.

