
At GitLab everyone can contribute to GitLab.com's availability. We measure the availability using several Service Level Indicators (SLIs) But it's not always easy to see how the features you're building are performing. GitLab's features are divided amongst development groups, and every group has their own dashboard displaying an availability score.
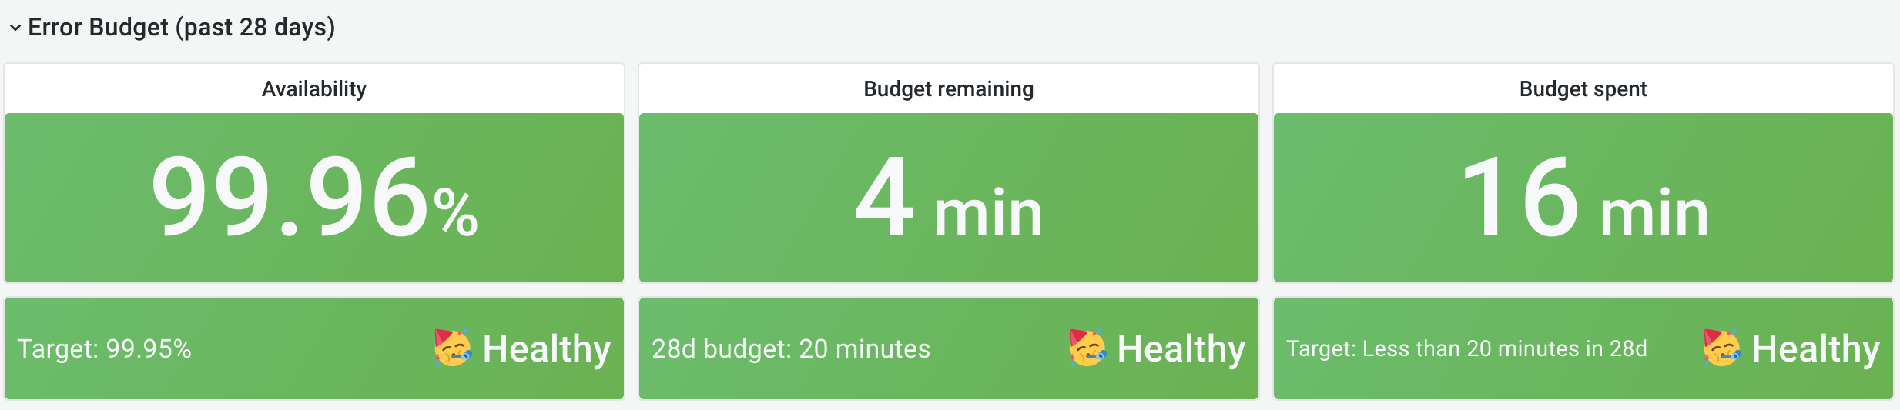
When a group's availability goes below 99.95%, we work with the group on figuring out why that is and how we can improve the performance or reliability of the features that caused their number to drop. The 99.95% service level objective (SLO) is the same target the infrastructure department has set for GitLab.com availability.
By providing specific data about how features perform on our production systems, it has become easier to recognize when it is important to prioritize performance and availability work.
Service availability on GitLab.com
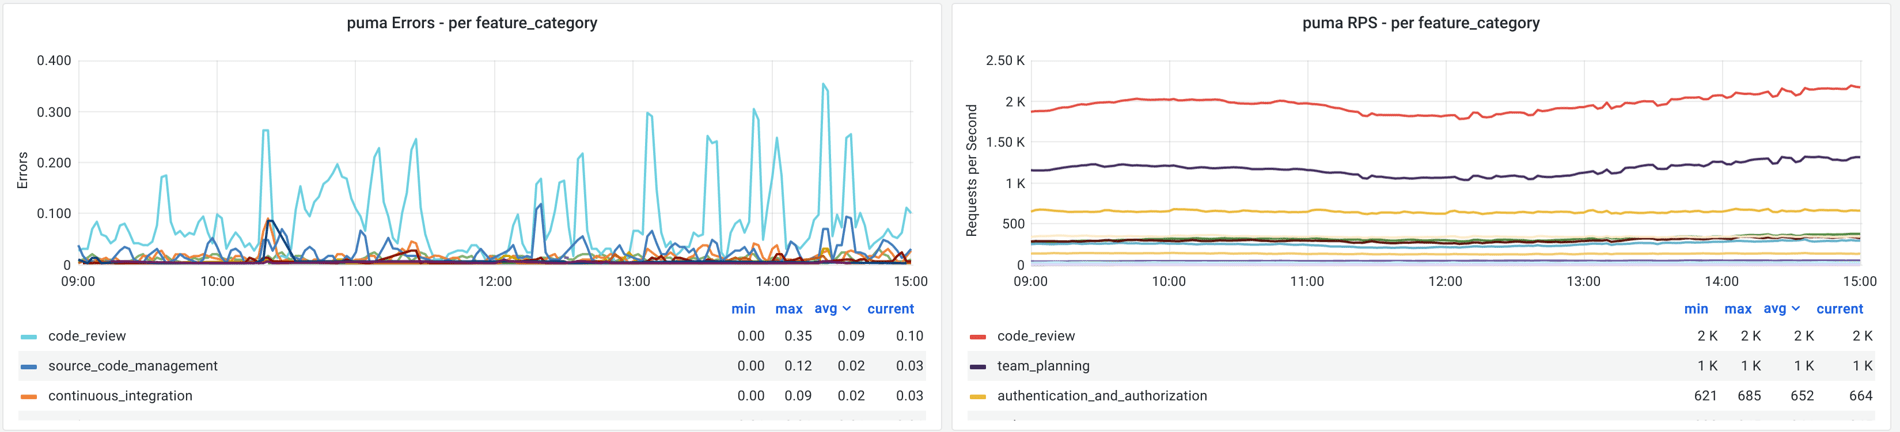
Our infrastructure is separated into multiple services, handling
different kinds of traffic but running the same monolithic Rails
application. Not all features have a similar usage pattern. For
example, on the service handling web requests for GitLab.com we see a
lot more requests related to code_review or team_planning than we
do related to source_code_management. It's important that we
look at these in isolation as well as a service aggregate.
There's nobody who knows better how to interpret these numbers in feature aggregations than the people who build these features.
This number is sourced by the same SLIs that we use to monitor GitLab.com's availability. We calculate this by dividing the number of successful measurements by the total number of measurements over the past 28 days. A measurement could be several things, most commonly a request handled by our Rails application or a background job.
Monitoring feature and service availability
For monitoring GitLab.com we have Grafana dashboards, generated using Grafonnet, that show these source metrics in several dimensions. For example, these are error rates of our monolithic Rails application, separated by feature:
We also generate multiwindow, multi-burn-rate alerts as defined in Google's SRE workbook.
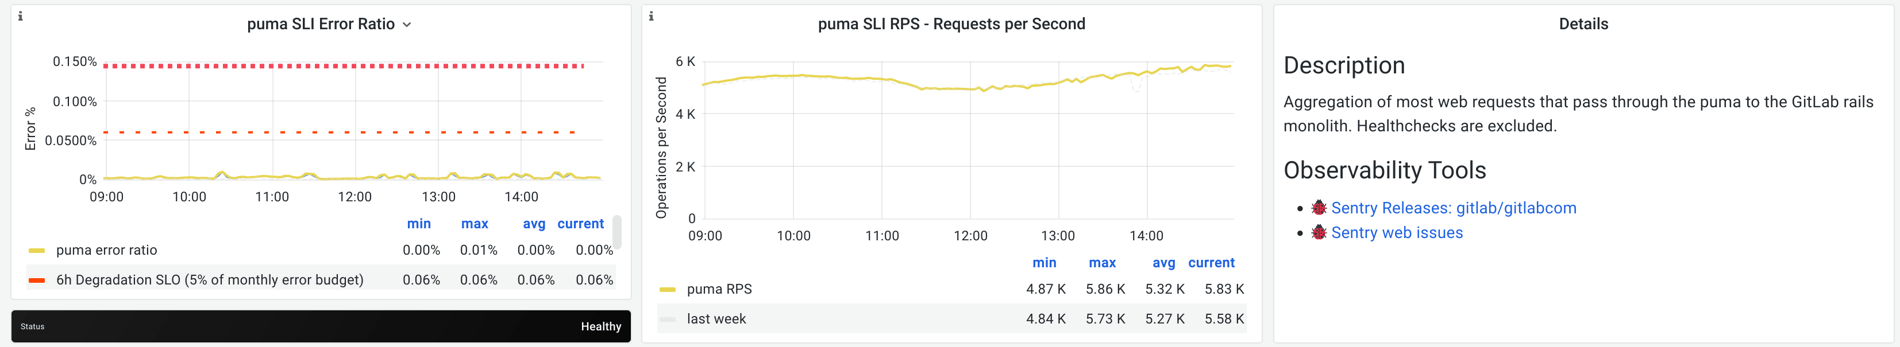
The red lines represent alerting thresholds for a burn rate. The thin threshold means we'll alert if the SLI has spent more than 5% of its monthly error budget in the past 6 hours. The thicker threshold means we'll alert when the SLI has not met SLO for more than 2% of measurements in the past hour.
Because both GitLab.com's availability number and the availability number for development groups are sourced by the same metrics, we can provide similar alerts and graphs tailored to the development groups. Features with a relatively low amount of traffic would not easily show problems in our bigger service aggregations. With this mechanism we can see those problems and put them on the radar of the teams building those features.
Building and adoption
In upcoming posts, we will talk about how we built this tooling and how we worked with other teams to have this adopted into the product prioritization process.

