Sample sizes for surveys
In a perfect world, we’d sample every single user within the population. However, we can’t do that. Why? It’s inefficient, expensive, time-consuming, and probably impossible to pull off. Instead, we try to attain a representative sample of the population from the population we want to focus on. To do this, we take a slice of that population, referred to as our ‘sample’.
Furthermore, we compute measures from the sample and use them as estimates of the measures for the entire population. For example, we can’t measure every users’ SUS score, even though that true SUS score does exist. Instead, we compute the SUS score from a sample of users. While it’s not going to be the exact SUS score for the population, it’s close within some degree of error (or margin of error).
Factors to consider when determing your survey sample size
One of the most common questions around sampling is ‘how many people should we sample?’ The correct answer is: ‘It depends’. There are several factors to consider when determining how large your sample should be. The main factors we look at are: confidence/accuracy, who you are sampling/how many people you sample, population, and the type of analysis. Further, not all studies need a high level of accuracy, but the information is still very valuable/useful, allowing you to make informed decisions. Here’s what we mean:
- Scenario 1: If your research questions require a high degree of accuracy, such as a granular measure, you’ll want to sample more people. Example: SUS (n=200)
- Why? SUS is measured over time, because we want to pick up on changes. When we see changes in SUS scores, we want to be confident that it is due to a true change and not because we were lucky or unlucky with our sampling. Smaller samples can be more sensitive to errors.
- SUS is measured across the entire population of users; therefore, we have a much larger pool of people to sample from. To ensure we have accuracy in the sample, we need a larger sample size.
- Company-wide goals are set around SUS. Thus we want a high degree of accuracy. As the sample size increases, your error (or margin of error)—in other words, your likelihood of lucky or unlucky sampling—goes down, and the observations you make with your data are more accurate.
- Scenario 2: If your survey requires a larger sample, you may run the risk of oversampling companies with more GitLab users/licenses (i.e., large enterprises). Example: CSAT (n=400)
- Why? Based on the results of our survey, we want to be able to say that our survey sample is representative of our larger population. If more than 1% of responses in a large scale sample (n > 500) come from a single company, then we have lower confidence in our results because that company is being over-represented in our sample compared to how they would be if we sampled our entire user base (i.e., population).
- Note: These guidelines do not apply if you are targeting a very specific or hard to reach user group.
- When trying to maintain the balance between accuracy and sampling, check your survey email distirbutions to limit how many individuals you target from a single company. You can do this by placing limits on how many people you query from a single company email domain or by filtering out specific email domains between email distirbutions through tools like Rally and Qualtrics. That way, your results are less likely to be influenced by those groups of users.
- Why? Based on the results of our survey, we want to be able to say that our survey sample is representative of our larger population. If more than 1% of responses in a large scale sample (n > 500) come from a single company, then we have lower confidence in our results because that company is being over-represented in our sample compared to how they would be if we sampled our entire user base (i.e., population).
- Scenario 3: If your research is trying to understand how many people are going through a certain workflow, or how people would rank certain features, you probably don’t need as many people to sample as the above Scenario 1. Example: survey to understand how users are ranking features (n=30)
- Why? Not all users use every workflow, so your population is not the entire GitLab user base. Rather, it’s all users of the workflow you are researching. A smaller population means you don’t need as large of a sample.
- You are not collecting a measure that is being compared over time. In other words, the measure is not as granular compared to Scenario 1.
- You don’t need a high level of accuracy to make a decision. Knowing from 30 users how they rank features is enough for you to make a confident decision.
- Scenario 4: If your research is trying to understand what kinds of tools users’ incorporate in their workflow, you will likely have more open-ended questions in the survey. Example: survey to understand tools in a workflow (n=30)
- Why? You don’t need as large of a sample for accuracy, since you are not computing a measure. Rather, you’re trying to get an idea of what responses users give.
- You might be looking to target certain tools that users list and want to conduct follow up interviews to understand how they are using the tool.
- A sample size of 30 is commonly used because that number is large enough to accrue a normal distribution in scores even from populations where there is a skewed distribution. In short, this number helps us prevent bias in our results.
Guidelines for survey sample size
To help make it easier to determine sample sizes, here are some guidelines:
- Ranking survey
- Sample size target: 30
- Quantitative survey
- Sample size target: 100
- Qualitative survey
- Sample size target: 30
These are general guidelines, but the size will vary depending on your study and the level of accuracy needed. You can use a sample size calculator, but you will need to know your population size.
Not every result needs to be statistically significant. You can sometimes gather enough responses to have meaningful inferences while not achieving statistical significance. What’s more important is to have a representative sample of the population of interest.
Reporting your survey sample size
Justification for your sample size is often needed to help other team members understand why you chose that sample size and what it means in the context of your results. When creating a report for your survey, we recommend adding a slide (search Survey Sample Size Overview Template in Google Drive to access) within the Appendix section of your deck to communicate the following information to stakeholders:
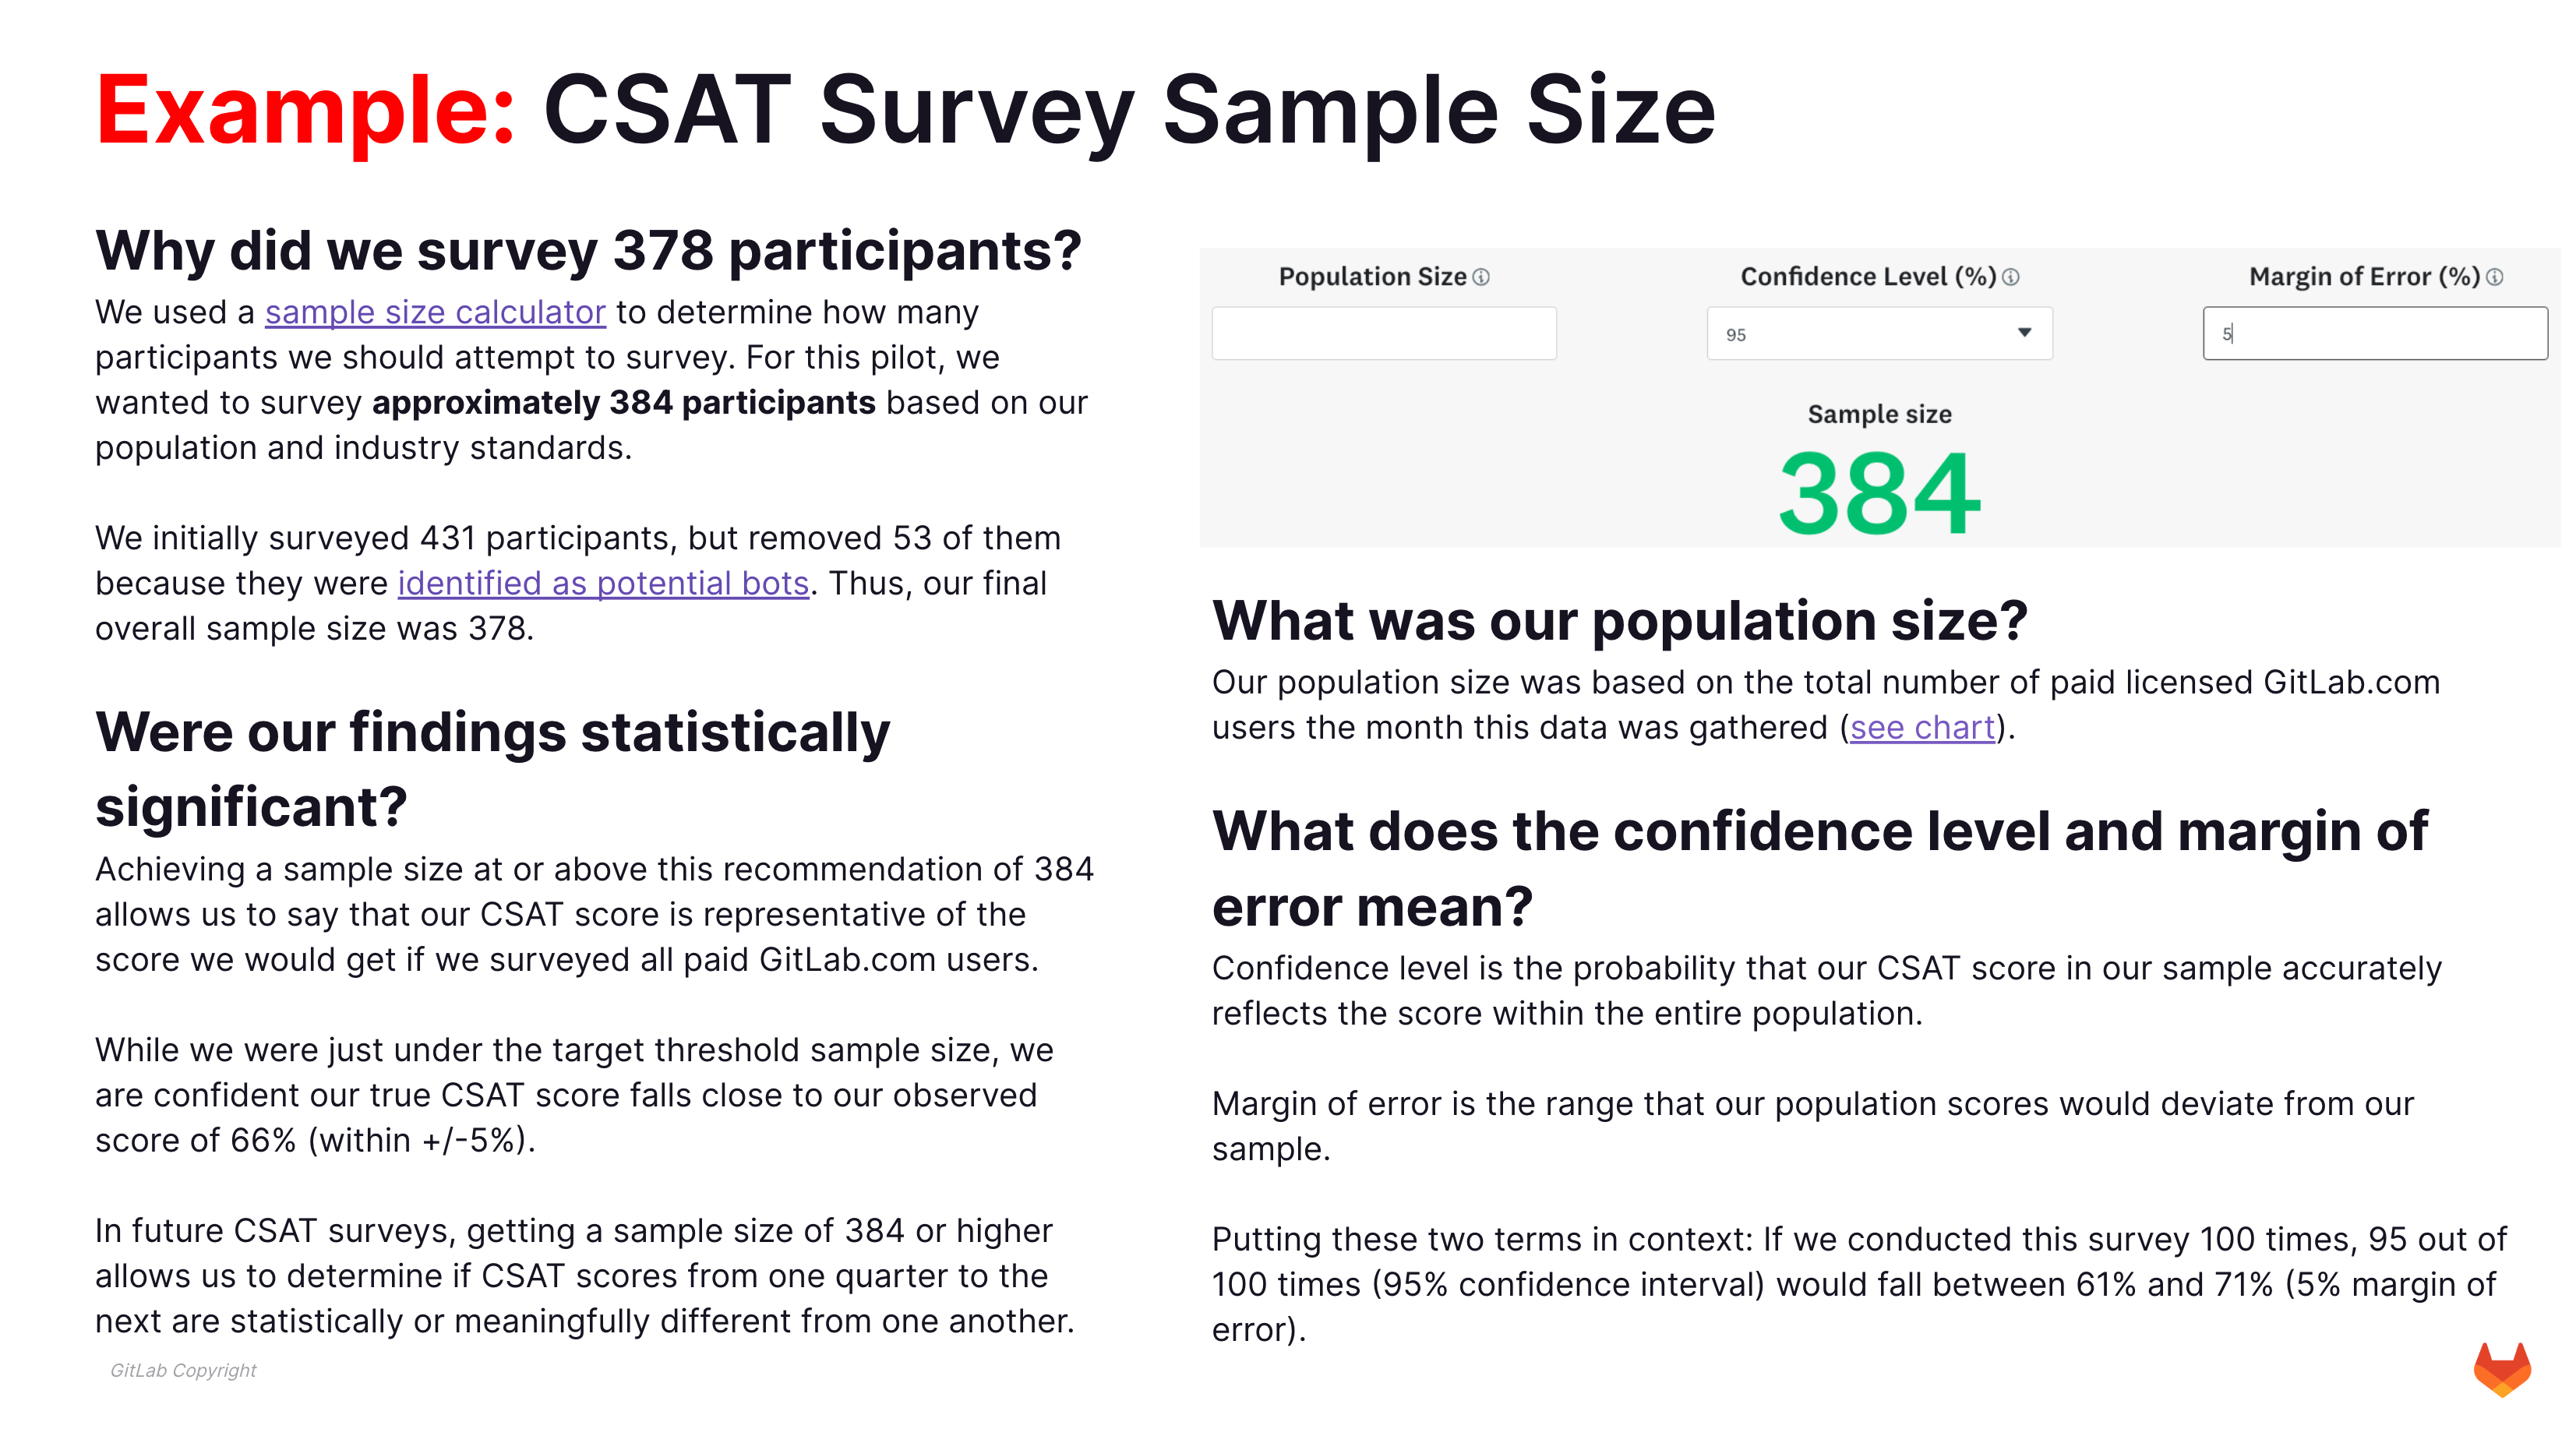
- Why did you survey that number of respondents?
- Were your findings statistically significant?
- What was your population size?
- What does the confidence level and margin of error mean?
Here is an example of a filled in report slide for a survey:
d927cbec)
