
There is Ops, Infrastructure, Performance, DevOps etc. The terms and titles go on and they vary based on a variety of industries, companies, and cultures. At GitLab, we focus on the philosophy not the title. In this post, I’ll explain why and how our team shifted our philosophy on how we approach GitLab's performance from an Operations mindset to an Infrastructure mindset.
Operations mindset
With more and more people using GitLab to host their public and private repos, run CI tests, and deploy to a number of different environments, we started experiencing noticeable performance and scaling challenges. We’d spot a problem and then race to get it fixed. The team was incredibly reactionary, working to fix this and change that. The reality is that computers will break and as you scale more things will fail. With this in mind, we could’ve taken the “Mongolian hoard approach” and thrown more people at the problem. However, that would have been another knee-jerk reaction and we could already see that the reactive way of doing things would never scale. So, we had to change. Our goal was to stop running behind the issues and start anticipating challenges in order to stay steps ahead of them.
The transition
Like most things, change is a process. Here are the steps we took:
- Focus on infrastructure: We shifted the team to drop the operations view that segregates systems engineering and instead focus on building infrastructure from a development perspective. Our goal was to get away from a world where developers code features and then system engineers deploy it and provision machines. We achieve better results when everyone has to be included in this process, either by building the product adding features, or by building the infrastructure and driving how the product uses the infrastructure to grow.
- Spot patterns: We built graphs to spot patterns. Fortunately, human brains are very good at pattern matching. It's just the way our brain works. Of course, just seeing the pattern isn’t enough. We’d spot the pattern and then work to match it to what we already knew were signs of good performance levels. The only way to be able to spot patterns is to commit to time based metrics that you will collect and then correlate.
- Mind the gap: When we spotted an unexpected or strange behavior we moved closer to the problem to understand where it was coming from, build a hypothesis, and then challenge our assumptions. We don't take feelings as data, if someone on the team feels that something is slow, we still need to get a number showing how slow, in a way that we can measure and reproduce the experiment.
- Align resources effectively: With data on what’s not working and how is this affecting your system, you can focus on the right problem and allocate the right level of people and resources to find a solution.
- Seek to automate: If you find yourself performing a manual task, you should do it once, twice, then many. By that, I mean you do the manual work once, a second time, and then you if you need to perform it a third time you need to automate it somehow. This is the laziness Larry Wall talks about in the three virtues of a great programmer. The goal is to stop doing the boring work a machine is so good at.
- Rinse and repeat: Take your graphs, make your assumptions, challenge them with an experiment, get your results, and start again following an iterative process, forever.
Cultural shift
Making this transition really forced the company to tear down the wall between development and production and collectively focus on building a better product. It’s been very important for our infrastructure team to have a "developer mindset". We need to find simple solutions to complex problems and constantly be working to code ourselves out of a job. Our team works to scale our software and our infrastructure by automating solutions. There will always be new challenges for the team work on next. For example, one of the problems that we faced recently was that we were going to run out of storage in a single appliance and we needed to fix this before we ran out, a show stopper kind of problem. Our process to get ahead of this was:
- Identify the problem: we are running out of storage space and performance. This opens the questions: how much time left we have?
- Add monitoring to understand what the context and environment is: monitor iostat, monitor filesystem growth, plan how much time we have left.
- Build a hypothesis and an experiment to challenge our assumptions: by using multiple shards we can buy time increasing complexity to move to a better solution.
- Run the experiment by building a small piece of infrastructure: attach a new filesystem shard to the nodes, and set up new projects to be created there.
- Learn, and move to the next iteration of solving this long running issue, leaving better tooling behind to make a better decision next time.
In this iteration we realized that our git ssh access timings where not to blame to NFS at all, it was all within ssh. We also learned that most of our traffic comes from new projects that are being imported into GitLab.com so most of the write load moved to the new shard. This is good information that we can use to plan our infrastructure using our resources better.
The story of a recent win: improve our ssh git access time
- Assumption: ssh is slow because we are doing a linear search in the
authorized_keysfile. Data to back up this assumption is the current graphs for io metrics in the main NFS server. - Experiment: adding an authorized keys api command and using it for openssh authorization will give better performance.
- Result: stabilized API access because of less filesystem access, but API is still slow:
- Assumption: web in general (API included) is slow because the worker nodes are being restarted too often
- Experiment: adding queueing times for http requests will give us understanding of how much time is a request waiting to be served.
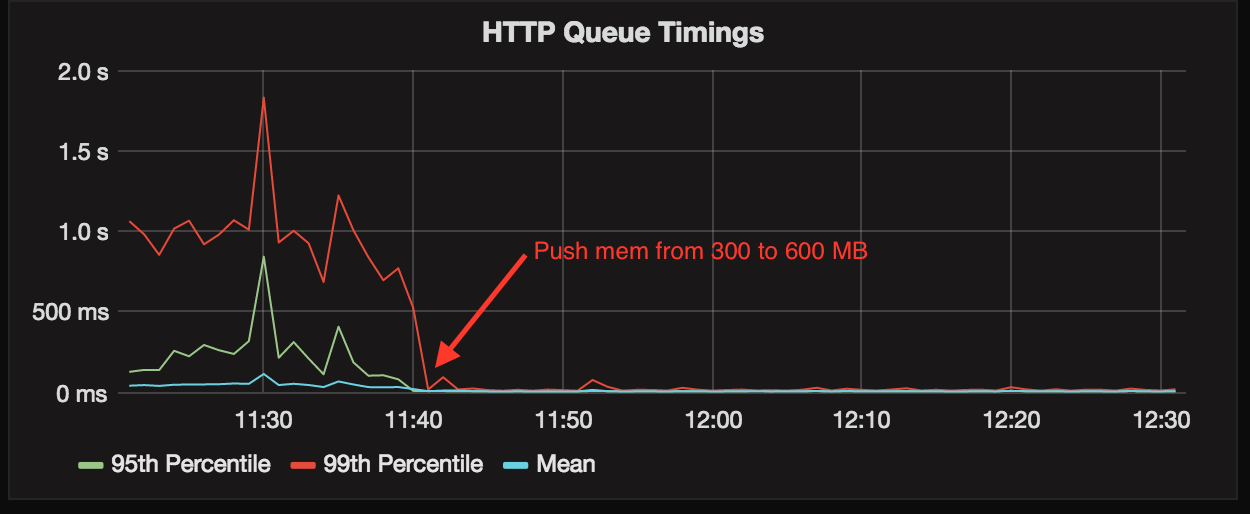
- Result: we had way better information and realized that our http requests where queueing for 1 second in the p99 case.
- Assumption: by preventing unicorn processes from being killed too often we will avoid enqueuing requests for too long.
- Experiment: increasing out of memory killer will keep workers running for longer.
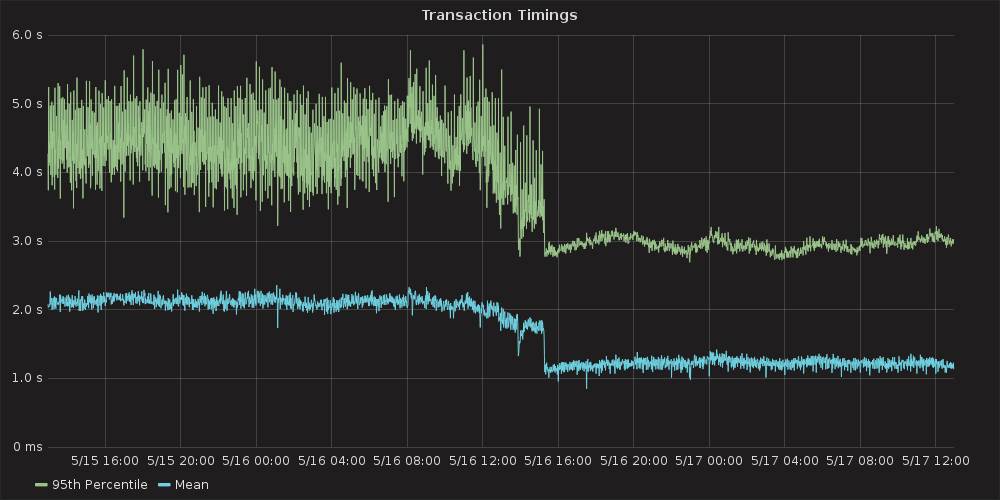
- Result: http queueing time dropped to virtually zero and transaction timings were also massively impacted:
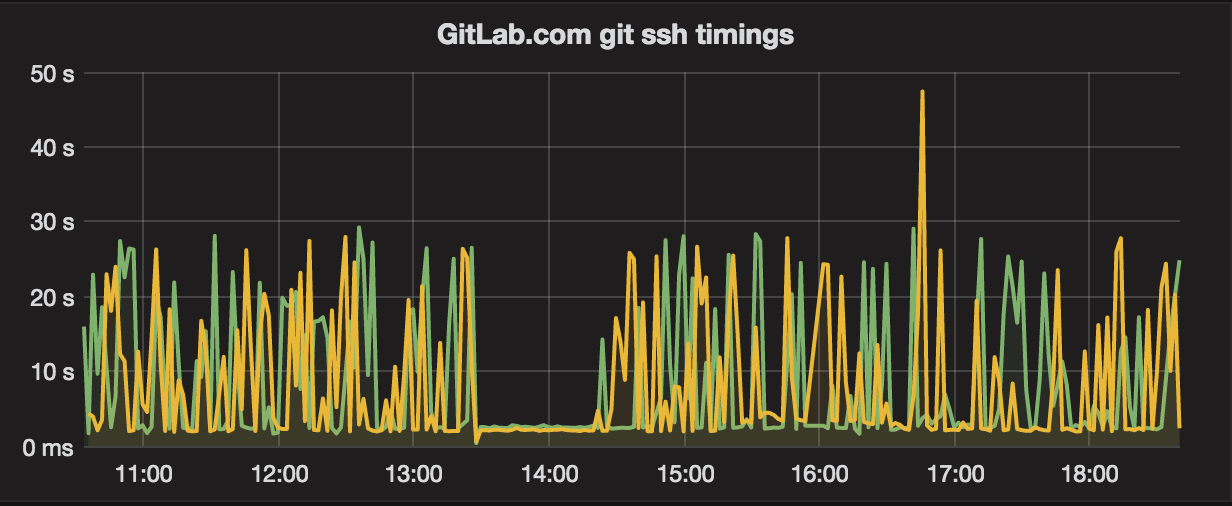
- New data: from the wider picture perspective, our ssh access is still irregular and quite slow intermittently:
- Assumption: after deeper investigation, dbus is queueing connections because of an arbitrary max sockets limit and bad file descriptor handling.
- Experiment: patching dbus in a PPA package and bouncing all the workers will remove the dbus queuing time.
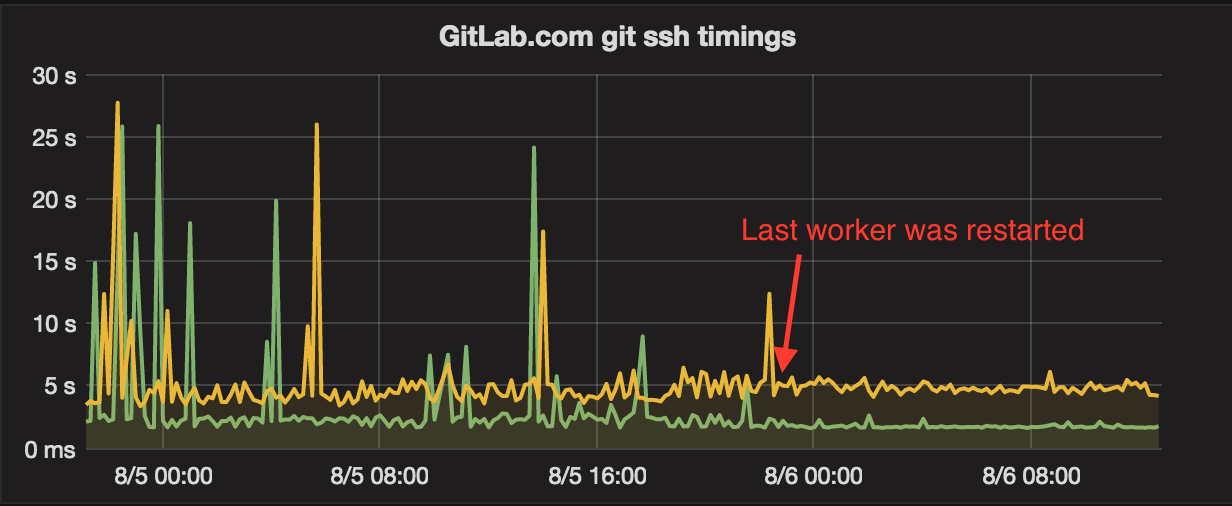
- Result: git ssh access stabilized at ~2 seconds for push, ~5 seconds for pull:
- Ongoing further actions: investigate how we can reduce those ssh access timings, and contribute back to the community so everyone can benefit from this.
Other things happened in the mean time, we added a public black box monitoring system to make our performance improvement efforts public. We used this monitoring to start with simple things, and over time we added more and more metrics to get better insight. For example, monitoring our ssh access times was as easy as writing a simple script and adding a cronjob to probe the access every minute. Only with this boring solution we managed to understand how was GitLab.com behaving, and we managed to see how it was evolving in our efforts to build a better system.
There were also some assumptions that proved wrong, but led to better understanding, for example: we assumed that our ssh access was being slow because of the TCP load balancing we do before reaching a worker node, this turned not to be the case when we started monitoring each node individually for better understanding. This kind of experiments are extremely useful because they will invalidate the assumption and make you look somewhere else - failing is an extremely important part of the process.
Our toolbox
Here is a list of the tools we use right now:
- Chef → infrastructure as code
- Prometheus → It will allow you to gather metrics in a time series providing good exploration tools. Then graph those metrics in grafana building dashboards.
- Blackbox exporter → It will allow you to see what your customers are seeing from the outside, if it's slow, you will see how slow
- Influxdb → Time series database, supported by GitLab for pushing white box performance metrics.
- Grafana → Graphing tool, we use it with both Influxdb and Prometheus to build graph dashobards that allow you to see how the application is behaving through time.
- ELK stack (Elasticsearch, Logstash, Kibana) → Log processing and analyzing system. Logs are usually the first source of information that can and should be used. There's no lower hanging fruit than writing logs that add value, then parsing these logs to see how is the system behaving. Something as simple as requests per minute will tell you how much the system is being used, add errors per minute to the same graph and you will know if your last deploy is broken and should be reverted.
- Sentry → Real time error tracking system.