Published on: January 5, 2017
14 min read
Prometheus and GitLab
Completing the application lifecycle with monitoring

A little while ago, we presented a first draft of our vision for monitoring within GitLab. We value transparency, so see below for the recorded video and transcript of the presentation, or view the slides directly. Please do give us your feedback on any of the linked issues!
GitLab monitoring vision 0.1
Thanks everyone for joining. Just to level set: This call is to go over a first draft of our vision for monitoring within GitLab. A version 0.1 of the vision, if you will. I’m presenting it so Sid and others can ask questions and critique it, and to share more broadly. If you’re looking for a polished presentation about a well-defined product, this is the wrong place. :)
I’ll start by talking about a potential minimum viable product (MVP), and then discuss future directions, and finally open it up to Q&A.
And if you want to play along at home, here’s a link to your personalized buzzword bingo card for the presentation.
Minimum Viable Product (MVP)
Use Prometheus to monitor GitLab installation
So the first step is to add Prometheus to monitor GitLab installations themselves. I won’t go into details here; and I believe Pablo will be giving a talk about how we’re using it. But in short, Prometheus is an open source monitoring solution. We’ve been using it internally here, and we’re going to bundle it up with GitLab CE so you can use it to monitor your own instances of GitLab.
Meta issue: gitlab-com/infrastructure/issues/589
Related issues:
- Expose service metrics via Prometheus
- Monitor CI end to end with prometheus
- Build public monitoring infrastructure
- Bundle Prometheus with GitLab CE
- Build High Available (Federated) prometheus monitoring solution
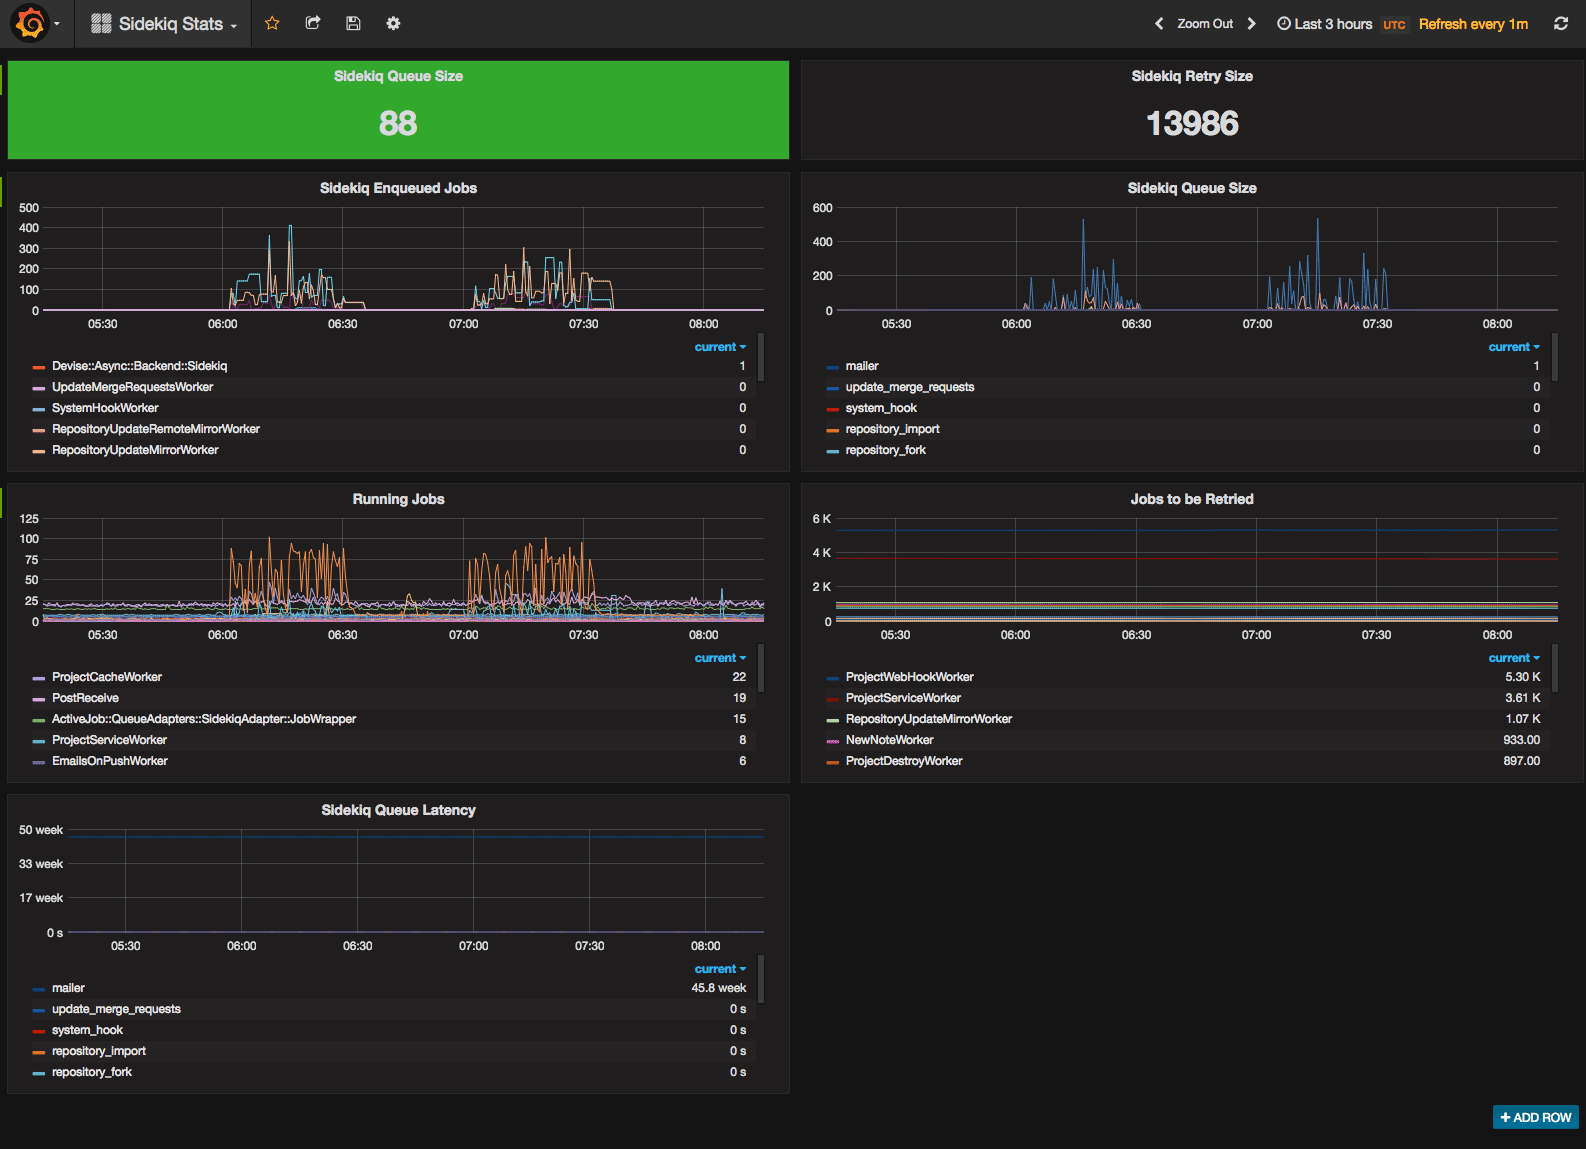
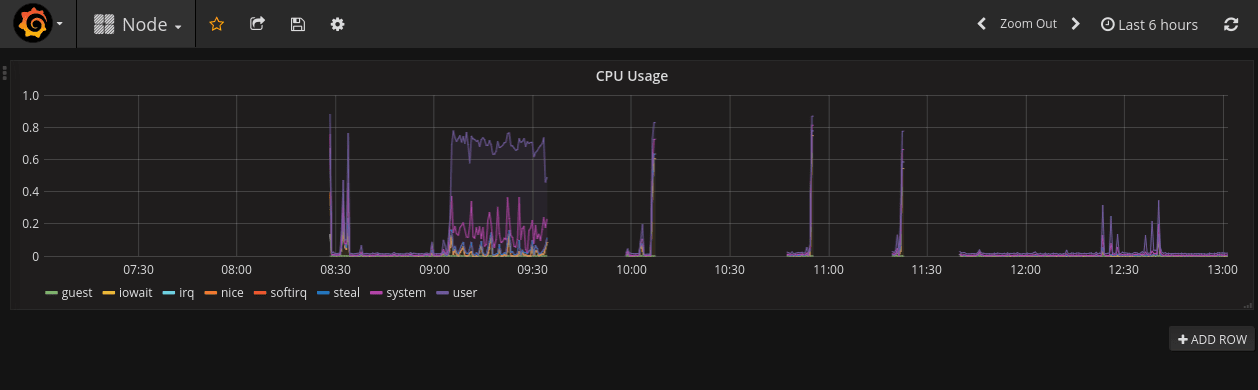
Here’s a couple screenshots I cribbed from some of those issues. Again, I’m not going to go into detail here. These are fairly traditional, if not ugly, dashboards using Prometheus and Grafana.
MVP+3
Web application monitoring
I kind of tongue-in-cheek called this MVP+3, but after some number of iterations, the next major step is to use Prometheus to monitor end-user applications. Ideally, providing a New Relic-like experience. Maybe it’s more accurate to say Heroku-like monitoring experience. New Relic does TONS of things we won’t touch for a long time, if ever. I believe there’s always a place for dedicated monitoring solutions that go deep. Our unique value won’t be in the deepness of the monitoring, it’ll be in the integration of monitoring into the rest of the experience. That may not be apparent in the initial release, but will show up later.
MVP focuses on:
- Limit to applications on Kubernetes
- Response: Throughput, latency, errors
- Resource: CPU, Memory, I/O
Initially we’ll focus on Kubernetes because that’s where we’re placing a few bets and installing Prometheus into every permutation of hardware is just too much to tackle. So to keep scope smaller, we’ll focus on Kubernetes.
We’ll start by measuring throughput, latency (or response time), and error rates. I’m calling this response monitoring, and it’s the highest value we can deliver that works for monitoring any web stack.
But measuring resources such as CPU, memory, and I/O might be easier for an MVP, so I’m keeping that open. Kubernetes may make some parts of that easier, but others harder. I don’t believe we should do all of this for an MVP, so my preference would be the web response side of things. The thinking goes: if one of the resources are constrained, say memory is entering swap too much, then that will show up as latency in the system. So I’d rather observe the material impact to the user directly. Unfortunately that means you don’t see anything until it’s already an impact. And knowing that latency is bad or error rates are up doesn’t help you debug the situation. That’s where resource monitoring can be useful. But still, as a first step, I want to know how my users are impacted and THEN find a way to debug it, at which point I may very well fire up New Relic to do more powerful analysis.
Monitoring alert on merge request
So to show how we’re thinking of integrating monitoring, here’s a merge request, that has already been merged and deployed to production. Because we’ve got monitoring, GitLab noticed that memory usage increased right after the deploy, so we get a message right on the merge request.
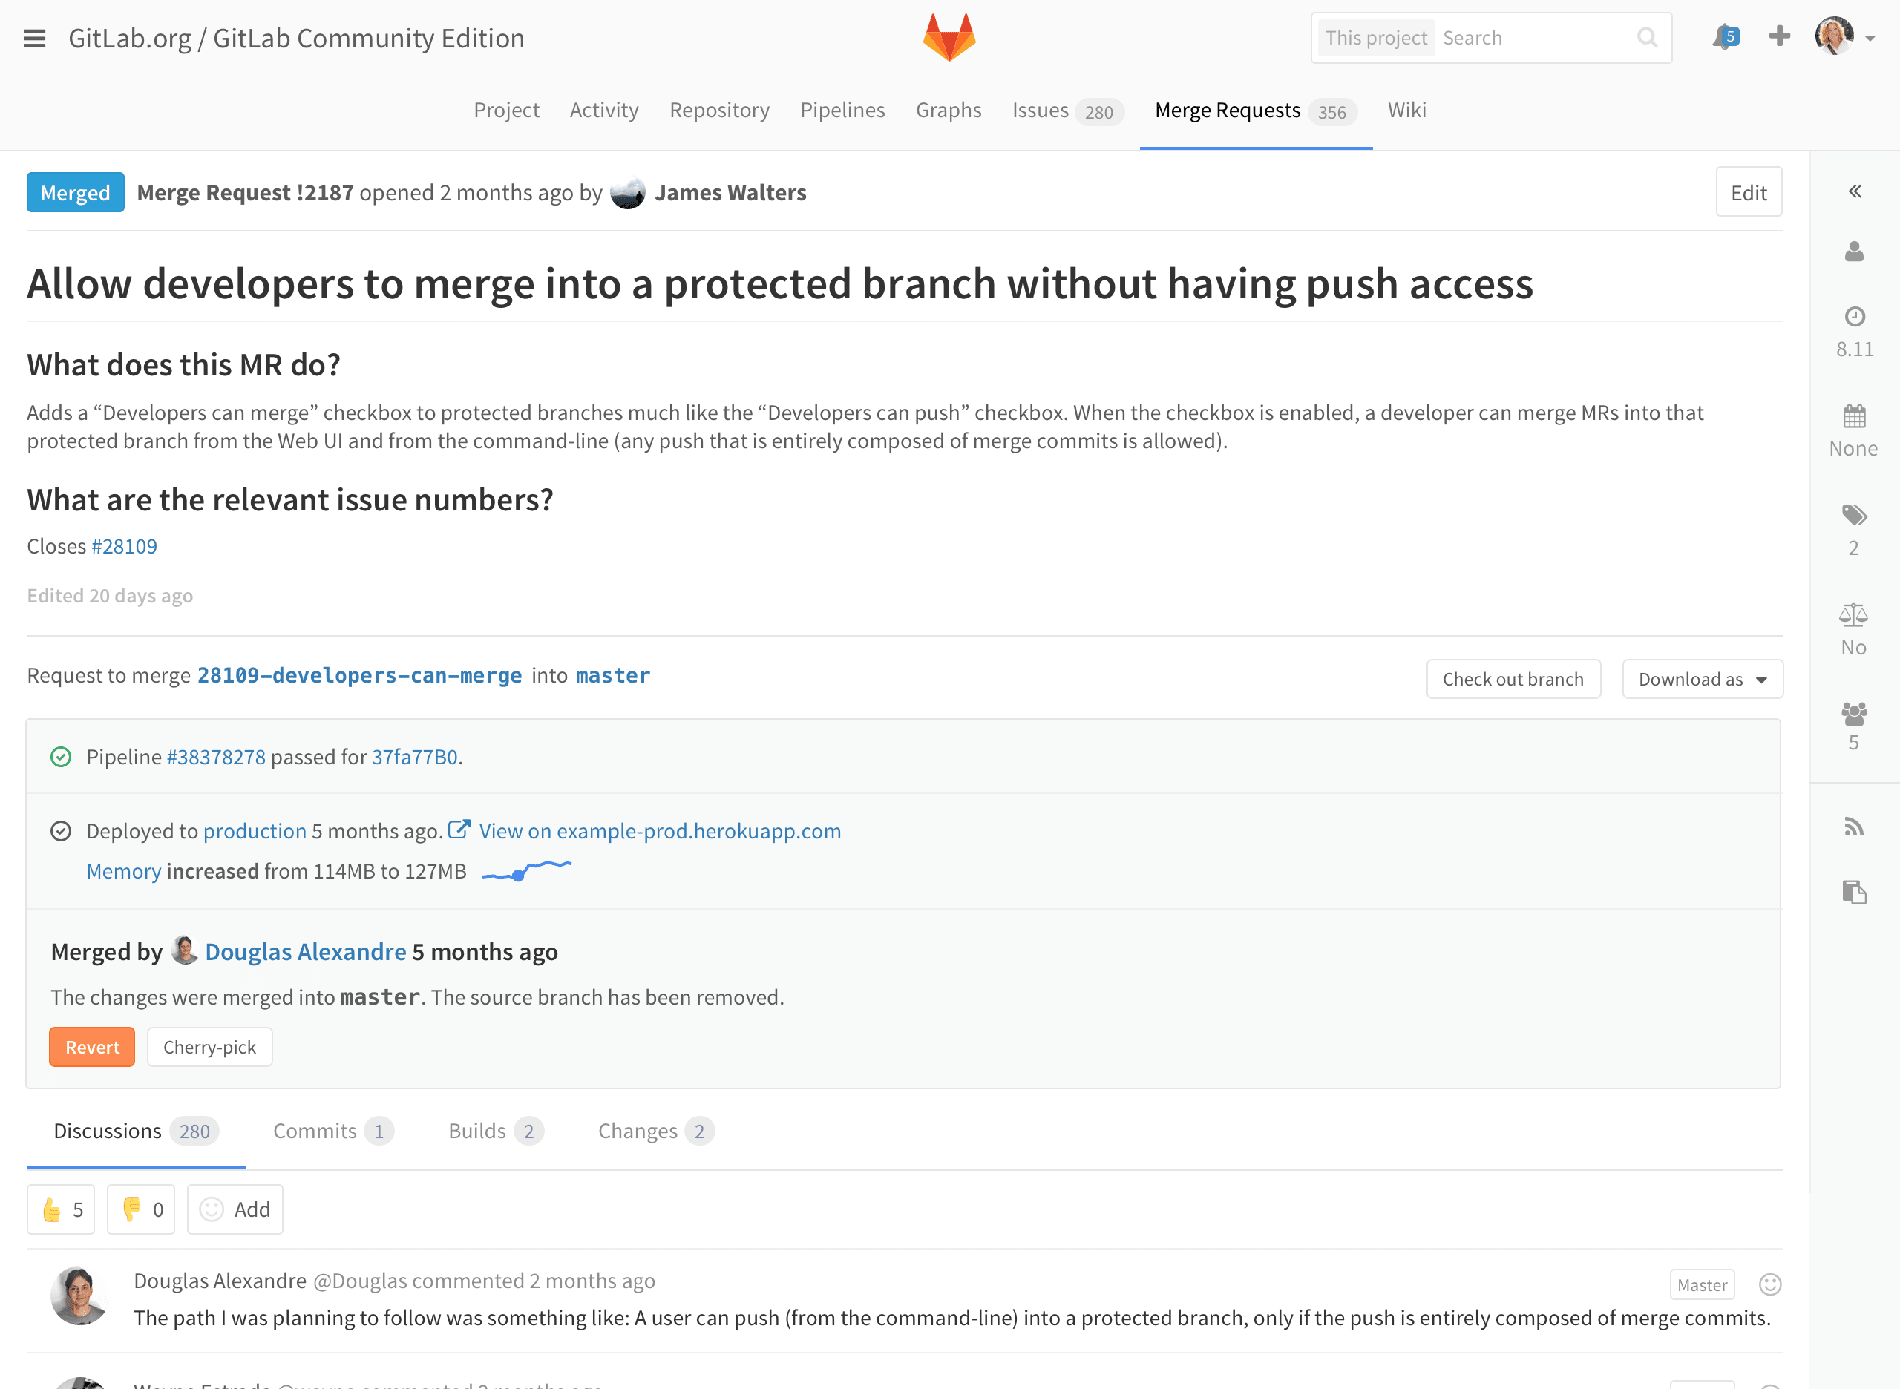
Let’s zoom in a little more. We see the alert, plus some summary information, telling you the memory usage increased from 114MB to 127MB, and a little spark line so you can see it graphically. Maybe we’d add a percent increase to make it more concrete. Of course, we’d also send an email notification of this alert, to the author of the actual changes about the impact. That way, this isn’t just an ops problem, the person or people most likely to be able to deal with it know as soon as possible. Now let’s click through and see more details.
Monitoring dashboard
So now we see something a little more traditional. This is an early mockup of how a monitoring dashboard could appear. Note even in this early stage, we’ve got lines showing when deploys happened, to help identify code changes that impacted performance. Maybe hovering over them would show a list of merge requests that were included in that deploy.
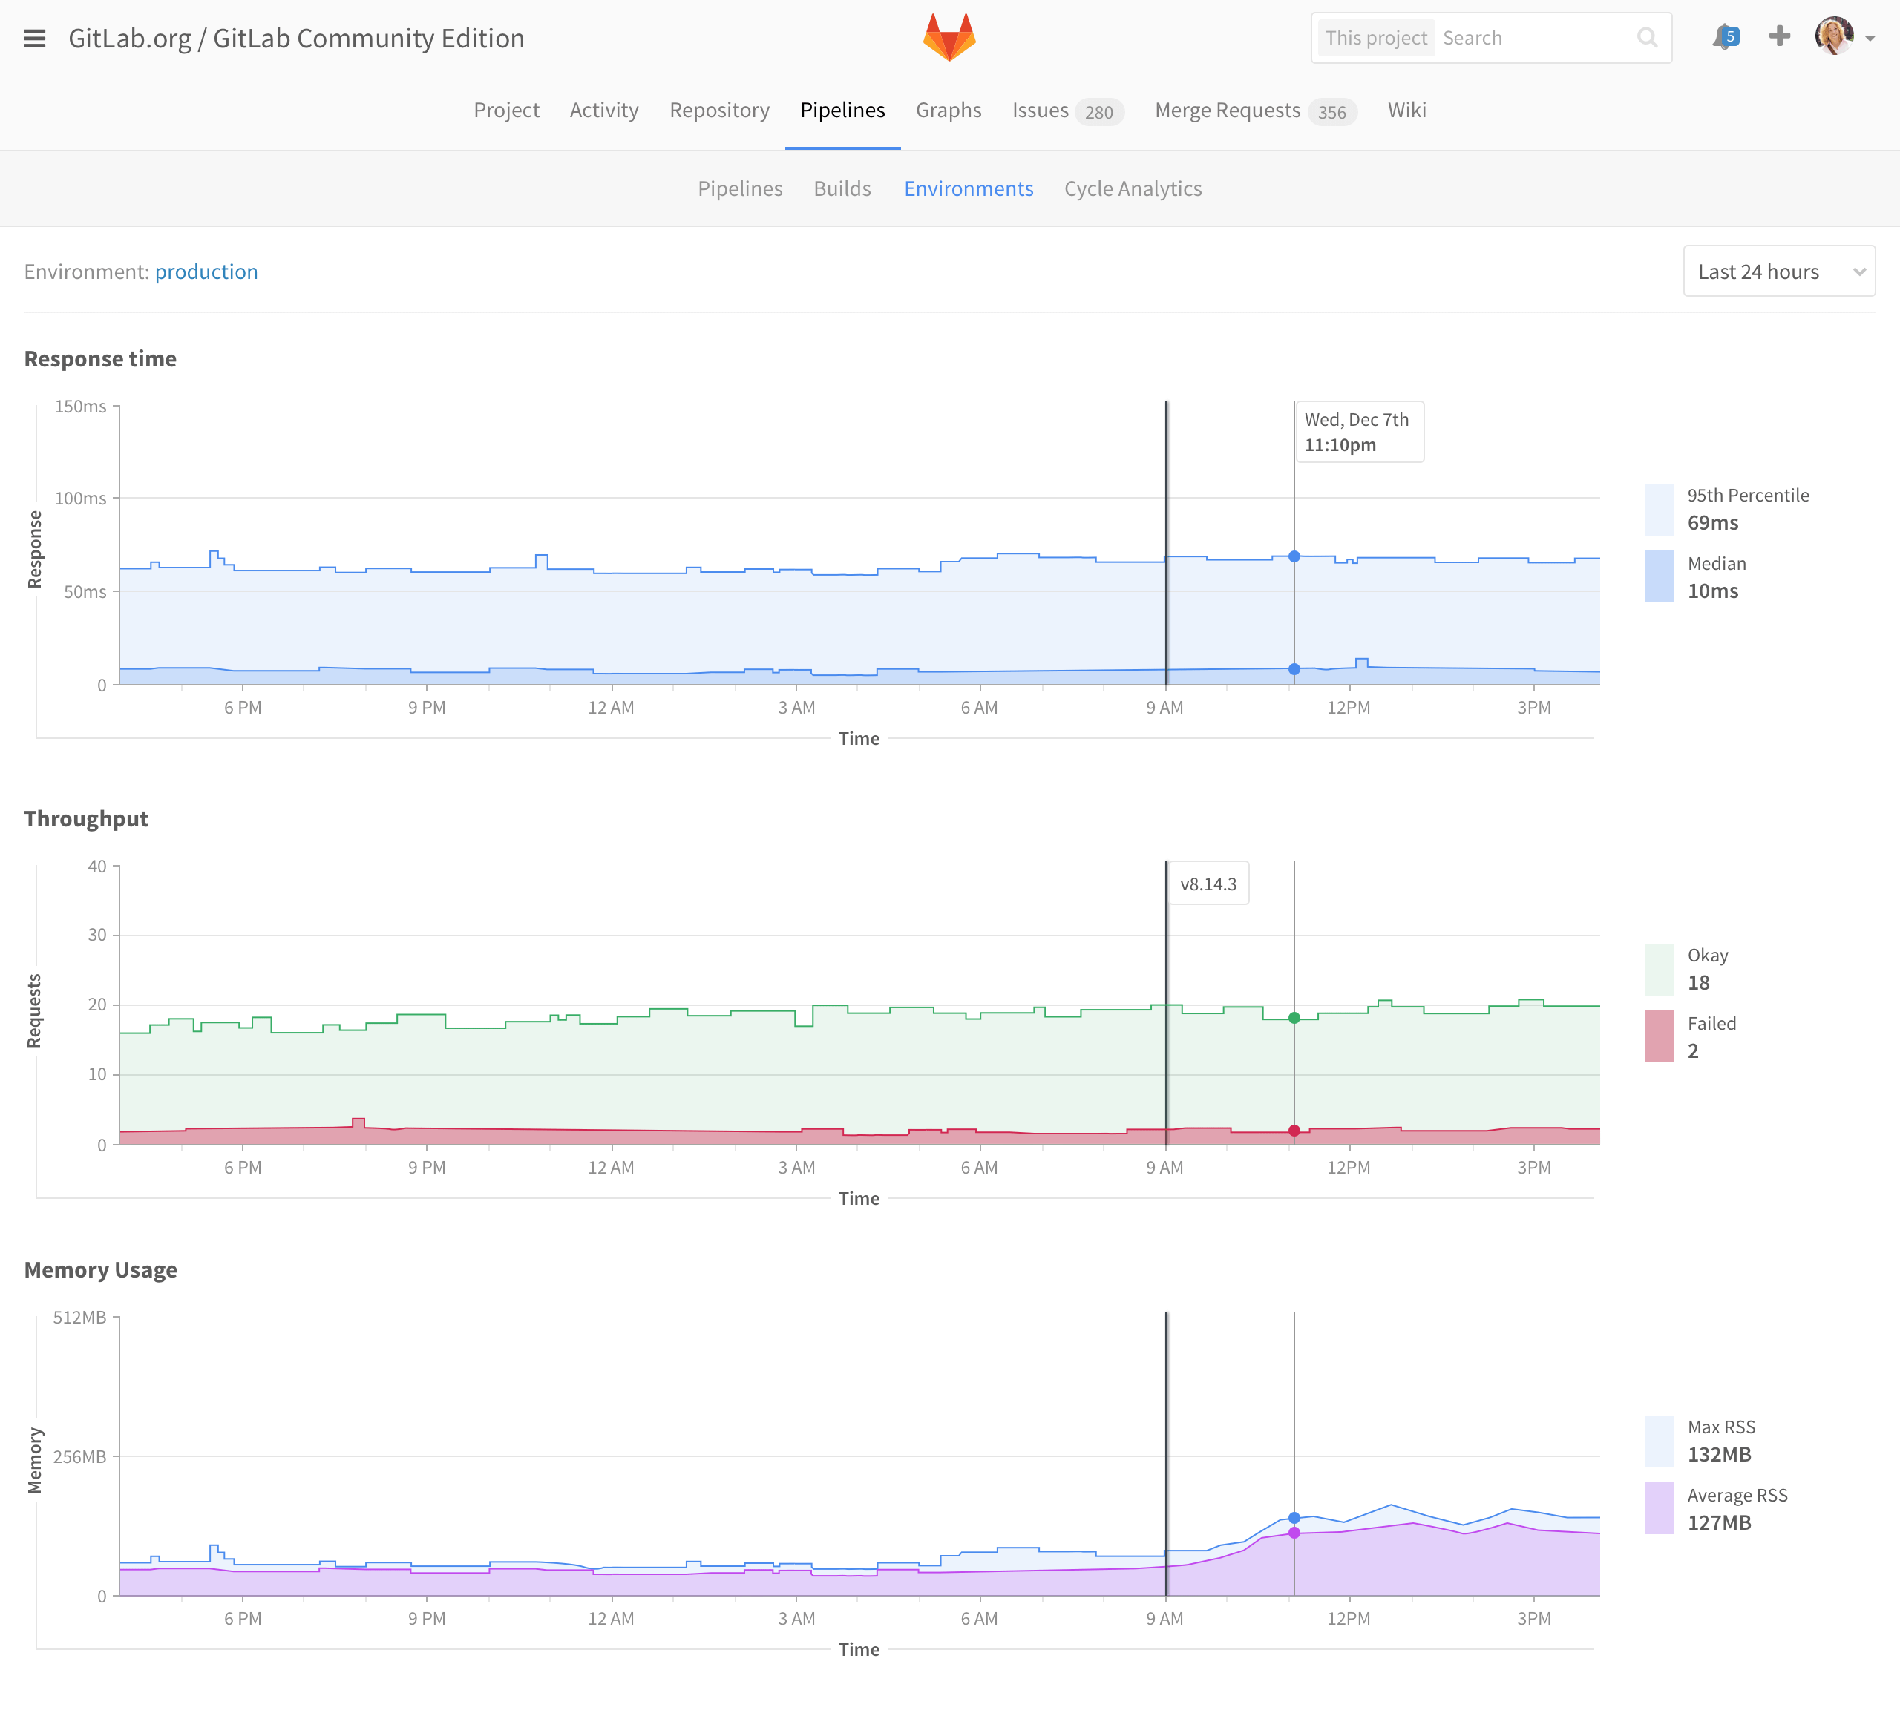
This dashboard would be available for all of your environments: production, staging, and review apps. Or maybe you’d only want to install it for production environments. I’m not sure yet. The point is that monitoring is an essential part of environments, deployments, and MRs.
Deployment history
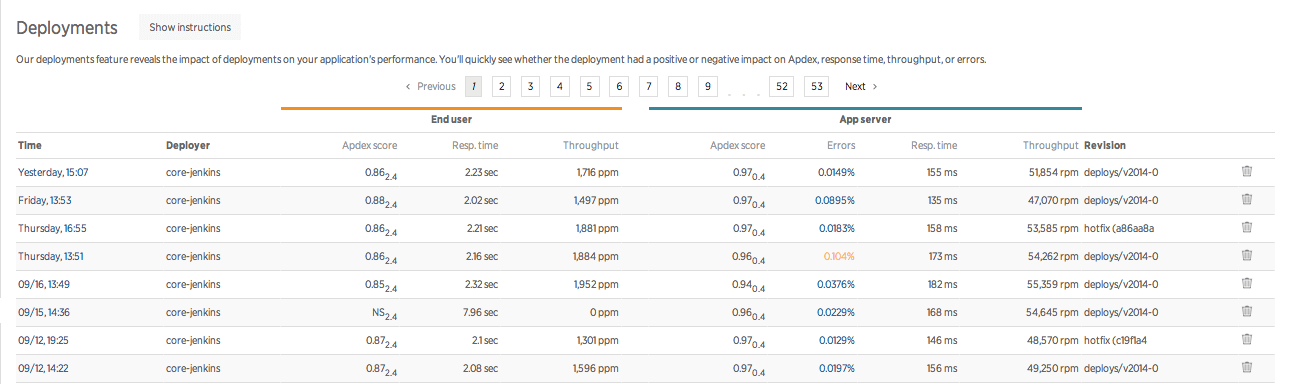
This is a screenshot cribbed from New Relic, but I could imagine some of this information show up on our deployment history pages.
Future
Monitoring++
- Response monitoring (throughput, latency, errors)
- Resource monitoring (CPU, memory, IO)
- Status monitoring (e.g. Pingdom, up/down/uptime, bad MR)
- Application performance monitoring (APM) (stack-aware, endpoint-aware, code-aware, db-aware)
- End-user experience monitoring (measured at the browser)
- User metrics/analytics (e.g. clicks, flows, funnels, a/b testing)
- User-defined / business metrics (signups, conversions, revenue)
- Integrated deeply, across the developer experience
So the future holds an infinite set of possibilities, but I’ll talk about a few directions I’d like to consider moving into.
First, there’s more to flesh out in response and resource monitoring, covering whatever we don’t ship in the MVP, and going beyond.
Then there’s status monitoring. Think Pingdom, which tracks whether your app is responding to a certain HTTP request to know if it’s “up” or “down”, and then alerting on that, and reporting uptime. The linked issue describes an MVP that just checks a URL after each deploy to see if your merge request borked the server or not. I have no idea yet what role Prometheus may play here.
Then there’s the broader application performance monitoring, which really is a superset of these other pieces, but I’m breaking it out to differentiate monitoring that usually requires your code to be instrumented with a client library installed in your application; like a Gem file or an npm module. Generally, it’s language, framework, and stack aware, can analyze code paths, and even profile database SQL queries.
The next level most APM companies go to is end-user experience monitoring; measuring latency at the browser so it includes the entire trip over the interwebs, and including the time to finish asynchronously loading all Javascript and actually rendering the web page. This gives a truer, and often much scarier, view of the performance of your app.
Then there’s user metrics/analytics. Clicks, flows, and funnels.
Lastly, we’ve got user-defined or business metrics like signups, conversions, revenue, or really any action that you determine is important for your business success, or just fun to watch.
Now, I’ve pretty much just defined the entirety of several monitoring industries. Obviously we’re unlikely to be best-of-breed in all of these. At least not in the next release or two. So again, the focus really is how we can provide the biggest bang-for-buck, the 20% effort that delivers 80% of the value, and really leverage our unique value, and that’s in our deep integration; making everything easier to use because it’s already there, and more impactful because it’s integrated across the experience. Anyone can show a graph of performance, where you can see that deploy 123 of merge request XYZ caused a problem, but alerting right on the merge request itself, right after deploying it, and emailing the authors of the actual changes about their impact, well, that’s just the tip of the iceberg of how monitoring could permeate the developer experience.
Deploy monitoring
- Track status of deploy from start to finish
- Finer state detail (ready, preparing, waiting, deploying, finished, failed)
- Aware of rollout across multiple containers/servers
- Ability to abort a deploy
Now let’s go in a different direction and talk about something I’m calling deploy monitoring. Deploys aren’t just binary pass/fail, and they’re not instantaneous, but we currently kinda treat them as if they’re both. Deploys can take significant time, going through many different states, and across many containers or servers. Being able to track and debug that complexity is pretty important, especially for larger organizations.
Deployboard
So here’s an early mockup of how we could integrate this information into our environment view.
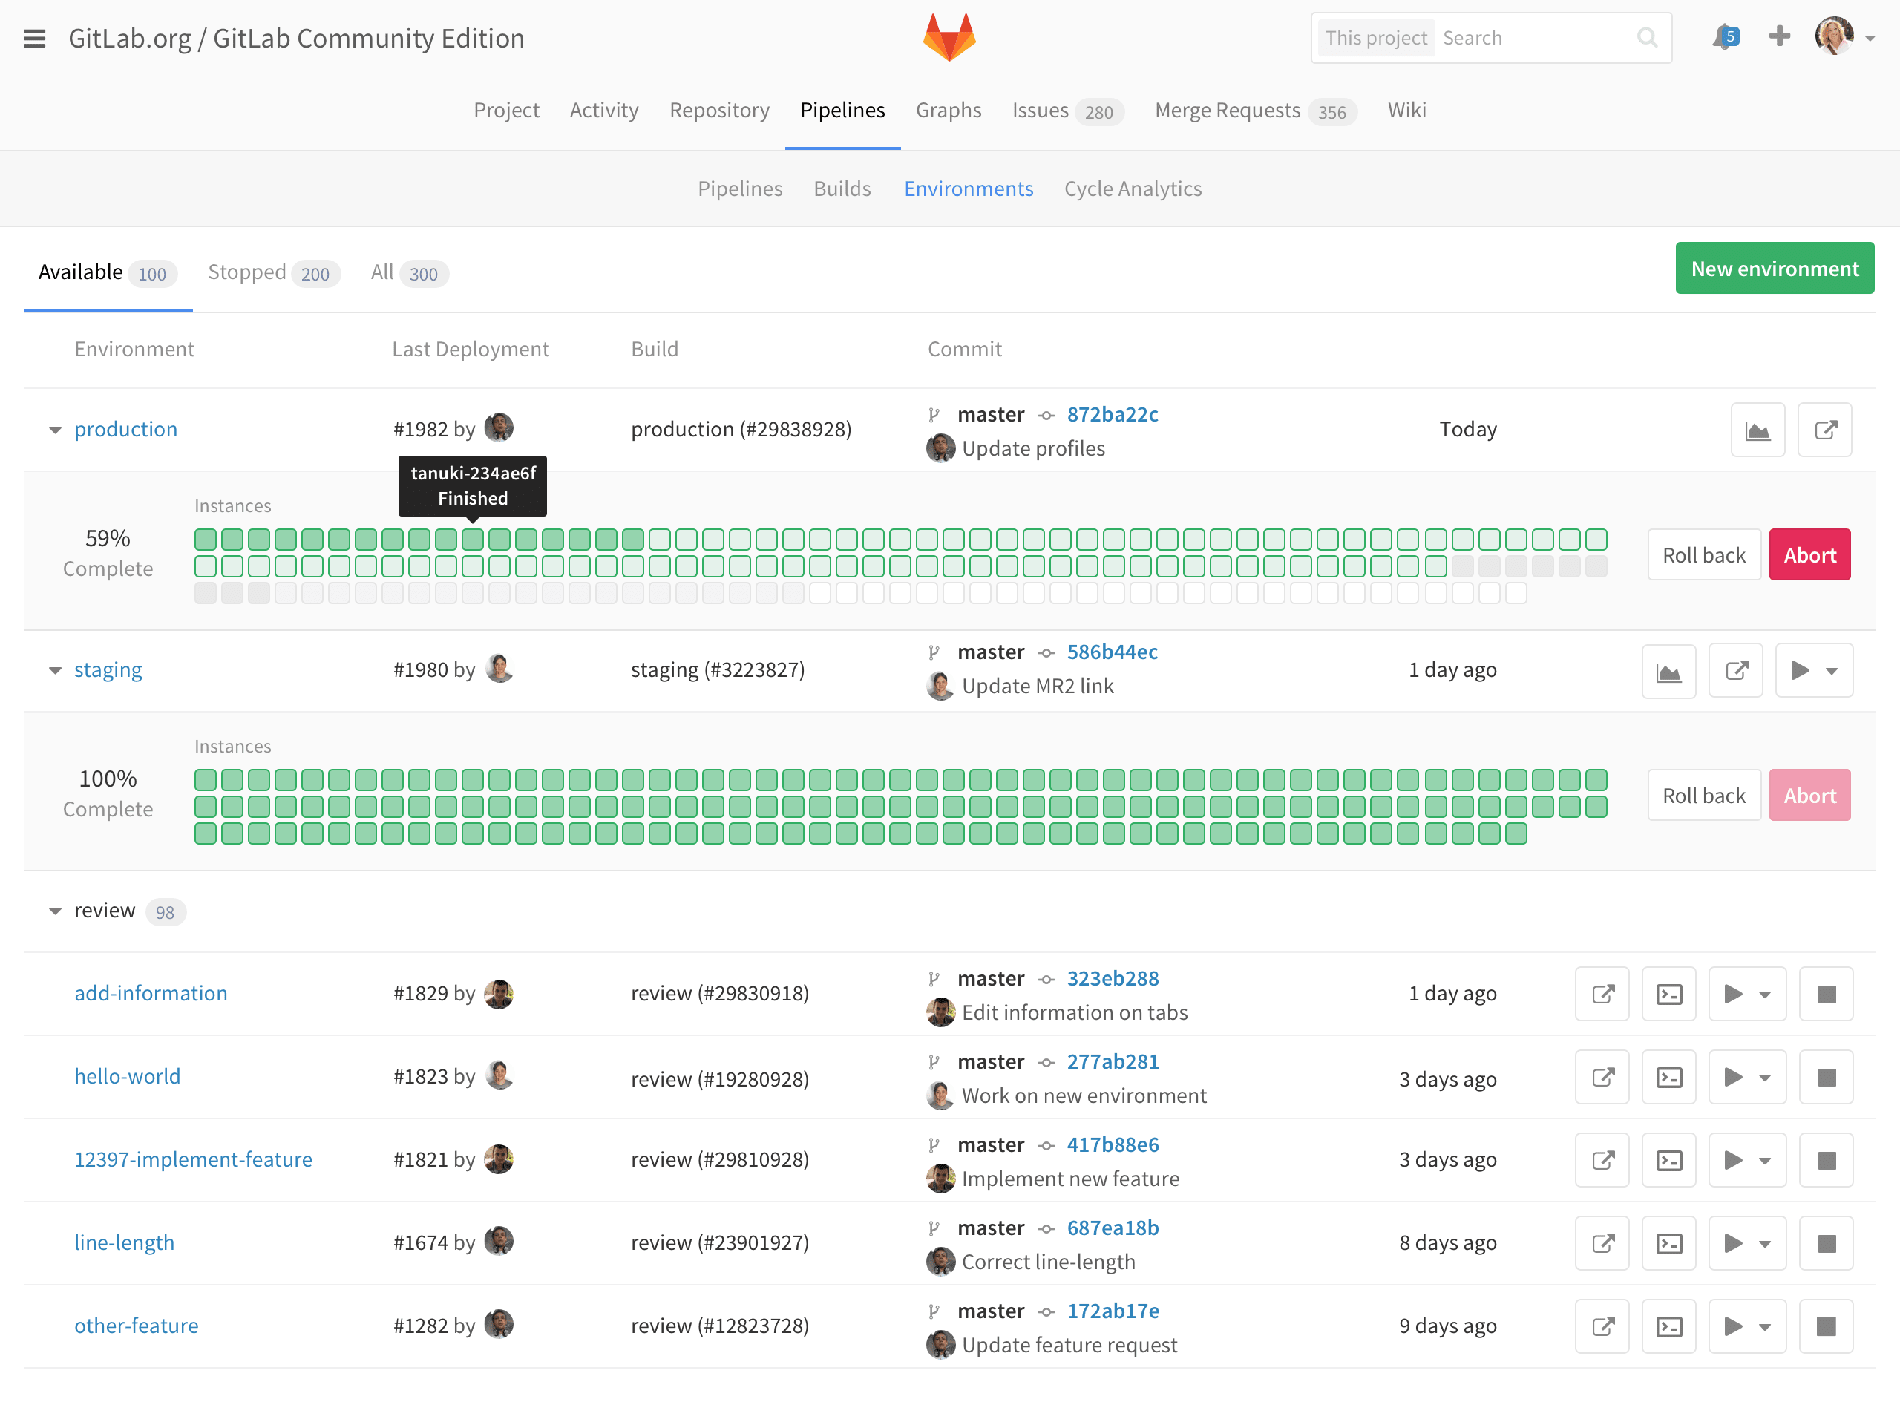
On staging, you see that the last deployment finished, but production has a deployment that is ongoing. Each square represents a container, managed by Kubernetes. Hovering over each one shows the server name and it’s current status. Clicking through might show more details about that container. Since this is the environment list, we also see our review apps, but we’ve hidden the deploy status by default since it’s less important for review apps. For any of these environments, you can click through to the monitoring dashboard I already showed.
Deploy monitoring++
- Notify authors of MRs that their changes are now live or in staging
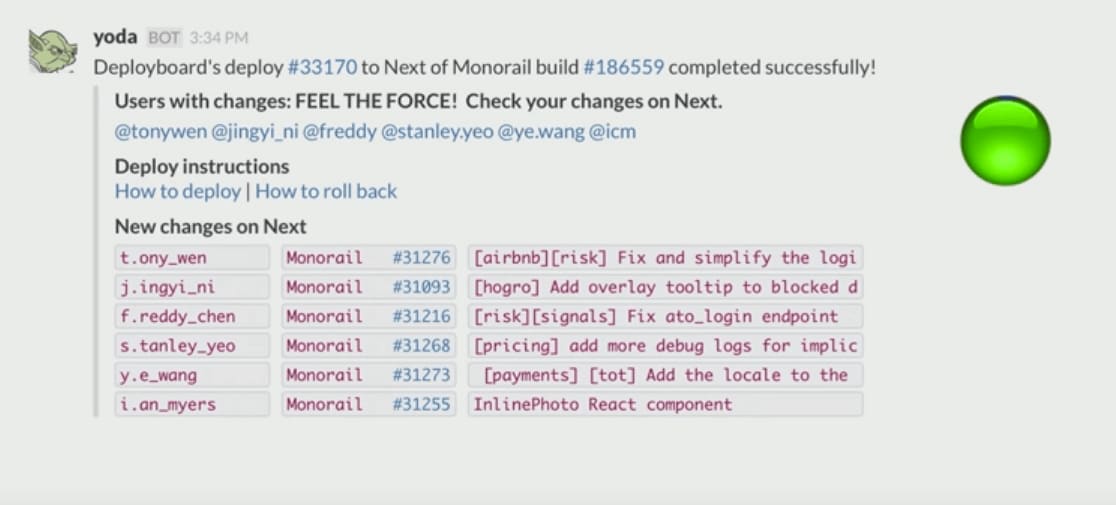
Now deploy monitoring is a rich area with lots of opportunities for growth. Here’s an image from someone else’s Deployboard that shows a Slack notification of a staging deploy, and @ mentioning everyone with code in that change.
Here are some other ideas I want to explore:
- Incremental rollouts (deploy to 10 containers at a time)
- Canary deploys (deploy 10 containers, then wait for stats or manual tests)
- Blue/green deploys
First is incremental rollouts where you deploy new code in batches. Say if you’ve got 100 containers to roll, you’d deploy 10 containers at a time, in 10 batches, until all 100 are done.
Closely related to that is a canary deploy, where you deploy to a few containers, and then stop while you wait some period of time for performance statistics to prove that there are no problems. Maybe even do some manual tests on those containers, although really that should have been done in staging.
And then there’s blue/green deploy, which has a few definitions, but the one I’m using here is where you have all your traffic going to one fleet of containers or servers, call that the blue fleet. Then you start deploying new code to a green fleet, but don’t send any traffic to it. When the green fleet is up and ready, then you cut over the router to suddenly send all traffic to the green fleet and the blue fleet goes idle. You could leave that blue fleet running in case you need to immediately revert. It’s much faster to switch a router over rather than wait for all servers to deploy again. If you’re using physical servers, these fleets may be permanent, meaning you’ve got to have twice the computing capacity at any time. If they’re containers, you can bring down the idle fleet after some time and then just spin it up again when you do the next deploy.
But again, these are standard deploy strategies that companies already use. Of course we want to support these best practices, but our challenge will be to integrate these closely into GitLab to deliver even more value from the integrated whole. Integrating deploy strategies with monitoring and our knowledge of the codebase, merge requests, and issues. Maybe an alert of a performance problem automatically generates a new issue labeled appropriately and assigned to the right person so it shows up in their todos.
Feature flags
- Decouple deployment from delivery
- In-code flag to execute one path or another based on externally controllable settings
- Binary switch
- Incremental (%) rollout
- Named group (internal, beta)
I’m going to go off on a tangent for a moment and talk about Feature Flags. Feature flags allow developers to decouple deployment from delivery while reducing risk. It’s usually an in-code mechanism, like an if statement, to conditionally execute one path or another based on externally controllable settings such as a simple all-or-nothing binary switch, or a more complex incremental rollout based on percentages, like turning it on for 10% of your users, or involving named groups like company internal, or a "beta” group. With feature flags, code can be deployed into production while the feature is still turned off.
My ideal rollout is something like:
- Dev team that created it ->
- internal alpha (all employees minus those giving customer-facing demos) ->
- select beta (~200 people that signed up for this specific feature) ->
- private beta (~1000 people that signed up for general beta) ->
- public beta ->
- 10% rollout ->
- GA
Features can then be rolled out to internal users, beta users, a percentage of production users, and then to everyone in ever-increases spheres. This help facilitate healthy real-world testing, restricting risk to affect only beta customers rather than everyone, for example, so that you get feedback earlier in the development cycle. Validate your ideas quickly. It also helps stay true to the premise of continuous integration which is that everything is checked into master often and deployed right away. This reduces deployment risk.
- Feature Flags as first-class citizens
- Compare flag states across environments (e.g. staging has X, which is not yet enabled on production)
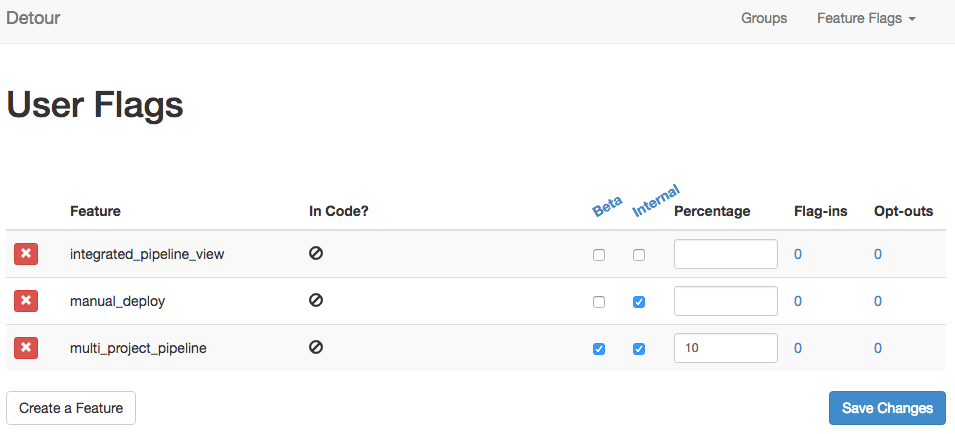
I'd like to see us work feature flags into GitLab in a first-class way. To be honest, I really don’t know how to do that. But I know I’d like to visually see, at a glance, which features are in private beta, for example. If a product manager tries to turn a feature on for general availability, they’ll be subtly reminded that they should consider going through private beta first. Companies should be able to set a rollout policy of what percentages things should go through at each stage. If done right, it’ll encourage a good rollout process, and make it trivially easy for users to follow the flow, every time.
Feature monitoring
Now to bring this back to monitoring, feature flags are another rollout mechanism, similar to some of the deployment strategies. So we should be able to monitor these, showing some analysis/graphing on them. Perhaps it’s a simple list of features and summary statistics about them indicating if they're performing as expected. Like:
- Feature X, rolled out to beta, decreased response time by 5%
- Feature Y, rolled out to 10%, increased conversion by 25%
The good thing is that since feature flags often run in parallel, so you’ve got some users with the flag and some users without, you can more accurately determine the performance or other impact. You don’t have to rely on point-in-time changes, like looking at memory before and after a deploy.
And it’s quite possible to have multiple flags at the same time, all at different rollout stages. With a deploy, which ships everything in master at once, if there’s a problem with one merge request 25 commits ago, you’ve got to rollback the entire stack until that change is gone. But feature flags are decoupled so if there’s a problem in an individual feature, you can just scale it down to zero without affecting any other feature, and without requiring a lengthy deploy process.
Another side note, since deployment strategies and feature flags are somewhat advanced topics that currently take quite a commitment to implement, most companies only focus on one of these strategies. If you work on feature flags, you’re not likely to bother with canary deploys, for example. But each tool has their sweet spot of value. Memory problems aren’t likely to show up using feature flags since memory is a system resource that’s really hard to pin down to a specific user. But error rates or conversion metrics are great for this. If we do a great job here, maybe people won’t have to be so stingy on their choice of tools.
Q&A
And with that, I’d like to thank you all for listening, and open it up to questions.
More to explore
View all blog posts


We want to hear from you
Enjoyed reading this blog post or have questions or feedback? Share your thoughts by creating a new topic in the GitLab community forum.
Share your feedback