
If you're new to the series, checkout Part 1: A Gentle(ish) Introduction
Reading time: 13 minutes, 32 seconds
Learning To Identify Waste
“Systems behavior is particularly sensitive to the goals of feedback loops. If the goals-the indicators of satisfaction of the rules - are defined inaccurately or incompletely, the system may obediently work to produce a result that is not really intended or wanted.” -- Thinking In Systems
Since following the Improvement Kata has gotten the group this far, they decide to use another concept from the Toyota Production System (TPS) -- waste reduction. To increase flow through the value delivery system, they start by looking at steps in the workflow that do not add any intrinsic value. TPS categorizes waste into 8 distinct types:
- Talent: Underutilizing people's talents, skills, and knowledge.
- Inventory: Excess products and materials not being processed.
- Motion: Unnecessary movements by people.
- Waiting: Wasted time waiting for the next step in a process.
- Transportation: Unnecessary movements of products and materials.
- Defects: Efforts caused by rework, scrap, and incorrect information.
- Overproduction: Production that is more than needed or before it is needed.
- Overprocessing: More work or higher quality than is required by the customer.
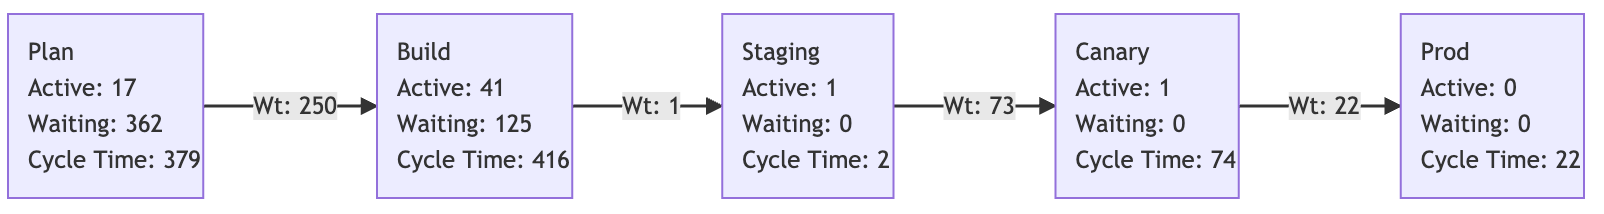
With this in mind, the working group pulls up their value stream map and immediately identifies a common theme across stages in the flow - some stages have a high amount of time spent waiting. The group quickly adds this up to understand the impact.

In total, work items spend ~85 days waiting between queues or waiting for additional work needed from other parts of the R&D team. The group is speechless as they realize that it only takes around 3 days of actual labor to move a work item through the value delivery stream. They decide this is the right place to start and prioritize their efforts based on which cycles have the highest amount of time in waiting:
- Build - 863 hours in a queue, 613 hours once a work item has started.
- Plan - 362 hours once a work item has started.
- Review - 27 hours in a queue, 95 hours once a work item has started.
- Canary - 73 hours in a queue.
- Prod - 22 hours in a queue.
- Staging - 1 hour in a queue.
The group is excited about their discovery and is eager to share it with the engineering team. When they sit down and show them the numbers, the engineers are surprised. The conversation continues with the engineers talking through what it looks like for a single engineer in a typical week. The working group captures it in a diagram and confirms with the engineers that it is representative of the conversation.
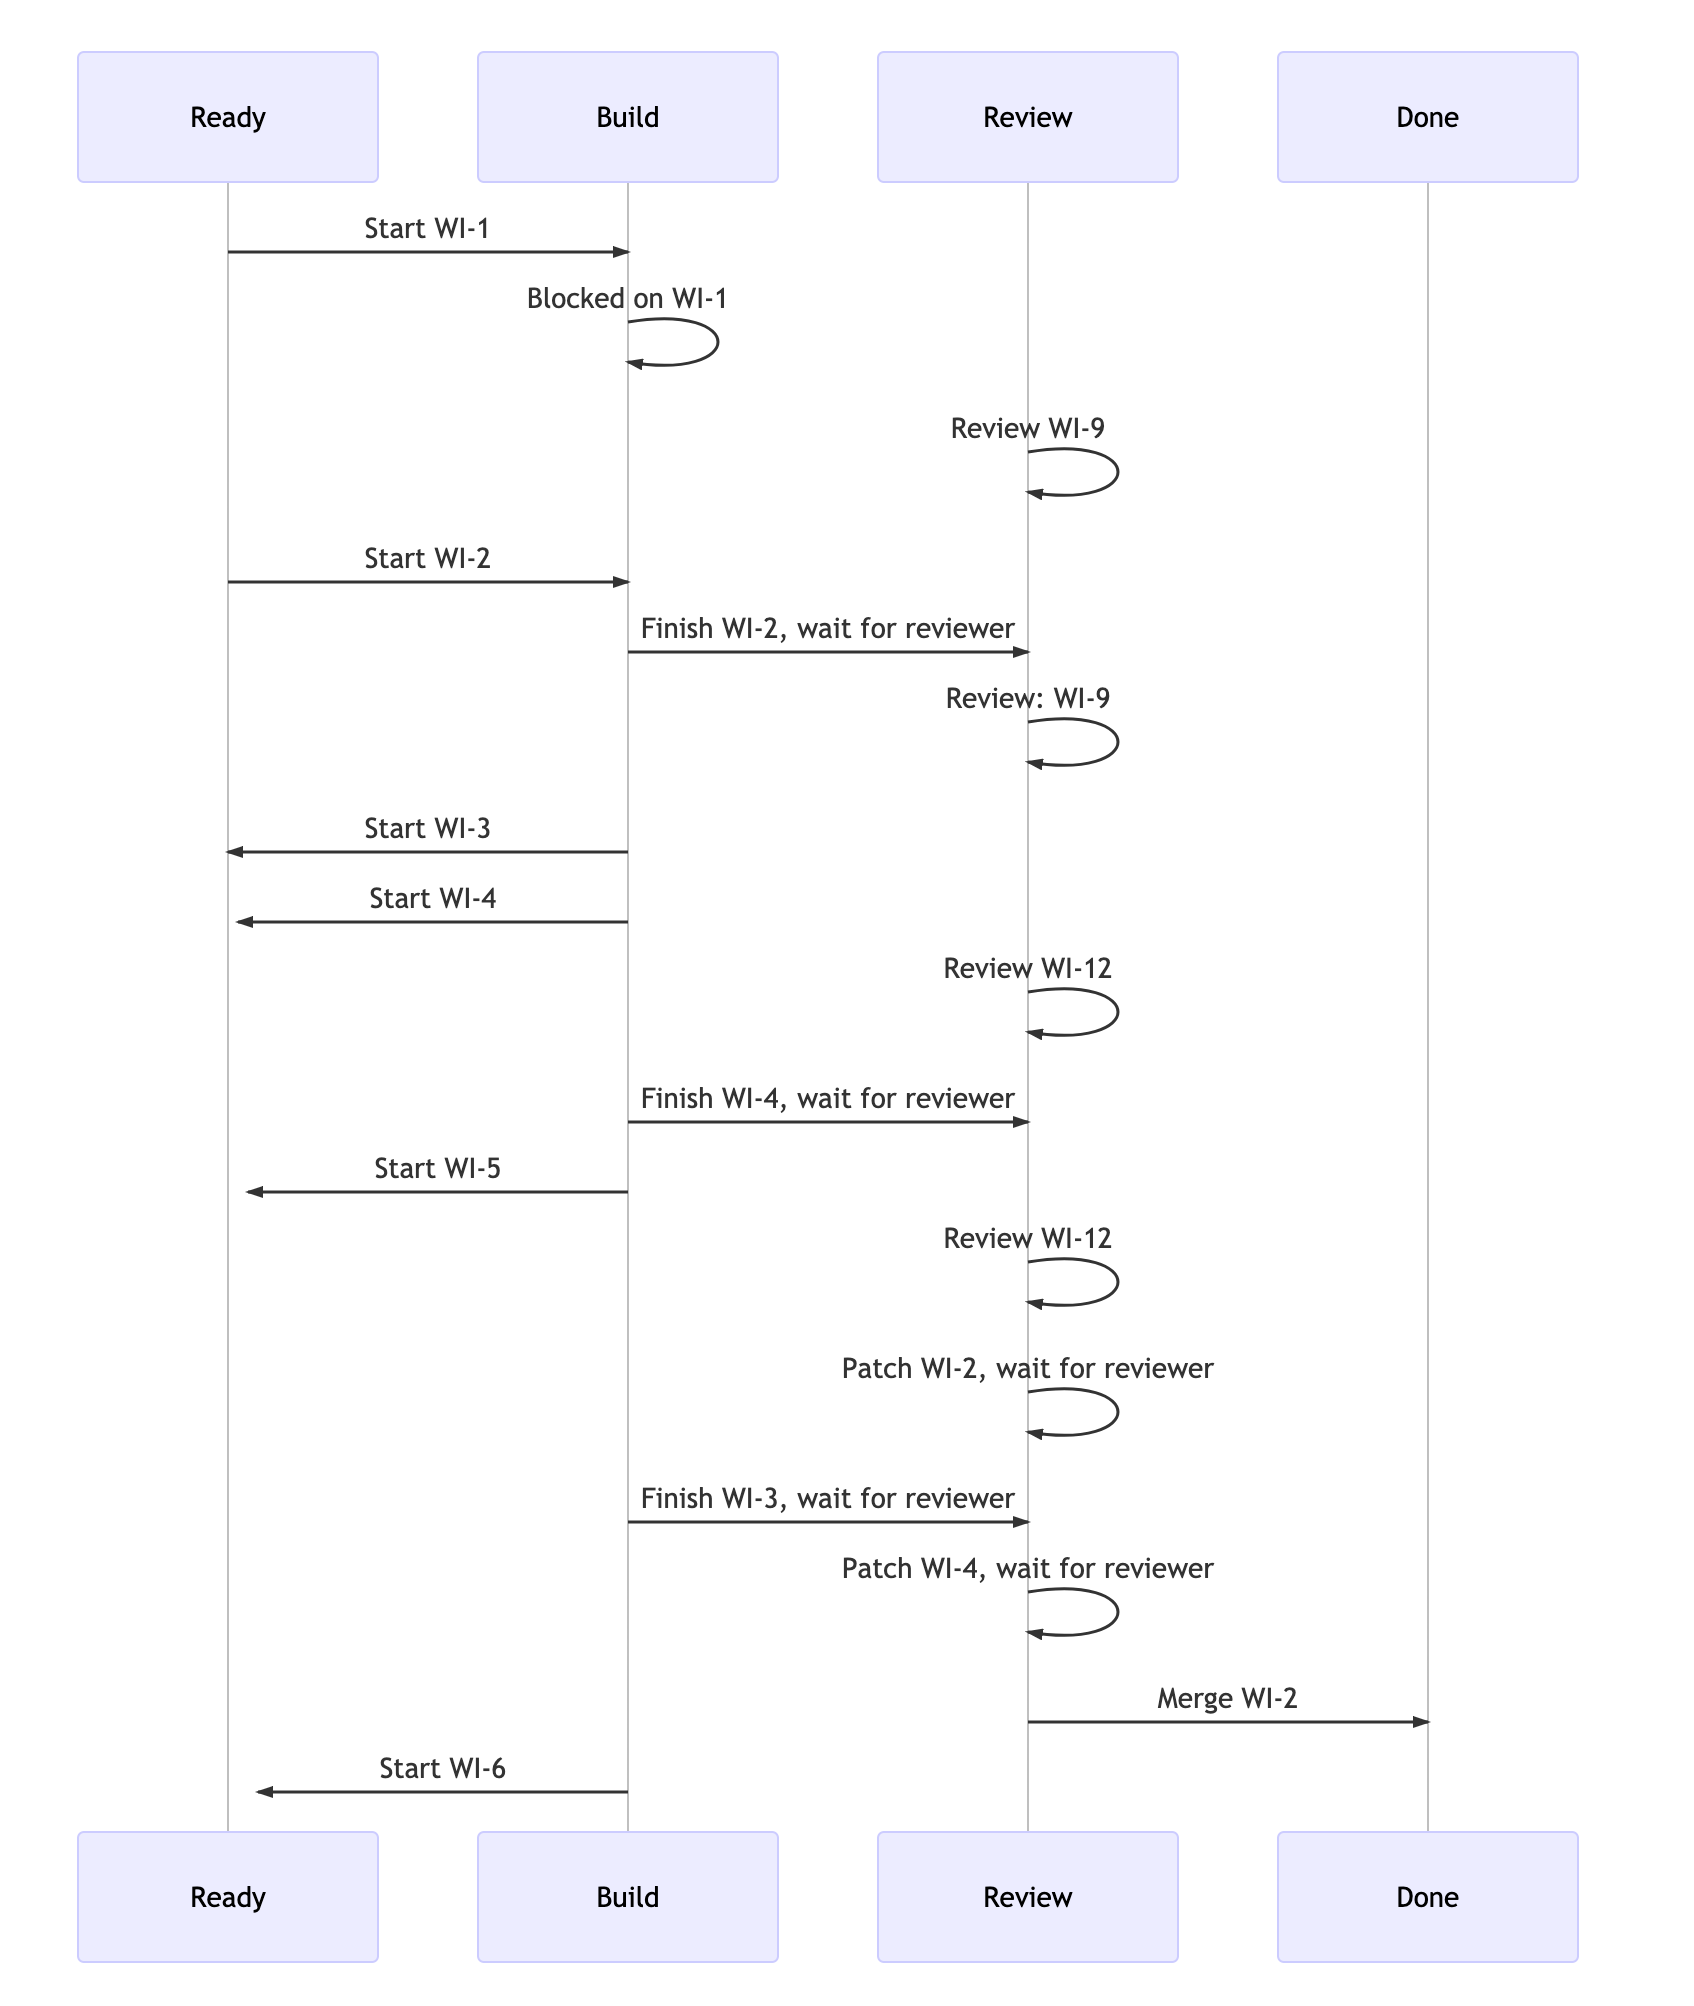
The group asks the engineers how they feel about this workflow. They're generally supportive as they don't see an alternative to this despite it being extremely heavy on the context switching. The working group still needs to figure out how to reduce the waiting time for work items in this stage and eliminated unneccessary waiting is a logical place to start. They present their target condition and ask the engineers for suggestions. The engineers feel strongly that the code review process is imperative to maintain code quality. One engineer suggests the team could try pair programming. He heard that it can increase code quality. It would also remove the Review stage entirely as two people contribute to the same work item until it is fully completed.
They debated back and forth. Many felt that it would slow everything down even more because they would only be able to do half the work they had been doing up to that point. The engineer who brought it up in the first place pointed to an a experiment where NASA engineers completed two like-size projects - one as they normally would and one strictly following Extreme Programming; which includes a mix of practices like pair programming, collective code ownership, TDD, and small iterations. He presented the team with the following data:
| Non-XP Projet | XP Project | |
|---|---|---|
| LOC/Hour | 24 | 27 |
| Util/test LOC | 0 | 1,135 |
| Prod LOC | 2,144 | 912 |
| Total LOC | 2,144 | 2,545 |
He explained that part of the reason why the team was able to produce less production code at a faster overall rate was due to the pair pushing each other not to cut corners by focusing on quality; ruthlessly refactoring code as they went. He also discussed the concept of the driver and navigator roles, and how that led to better architecture decisions the first time around. The engineers were skeptical but were willing to give it a try. Together, everyone agreed that the engineers would run an experiment to try pair programming for the upcoming quarter. They also agreed to only work on one item from start to merged before picking up the next item.
Increased flow does not equal increased value
At the end of the quarter, the working group got together to review an updated value stream map.
The work in progress limits and pair programming dramatically improved flow through the value stream. Lead time dropped to 893 hours or 37 days. A 57% reduction was much better than the working group had anticipated. The books for the quarter weren't closed, but the working group knew it was going to be a huge win. They eagerly shared the results with the executive team.
As the quarterly financials were released, the group got a call from the CFO. He was disappointed. He had expected to not only achieve the 5% incremental revenue growth but do much better given the results of the experiment. The working group was stunned. Revenue growth only increased from 5% to 9%. Despite missing the mark, the executives agreed to continue sponsoring the working group as it did produce tangible results and business outcomes.
Financials
| Previous | Current | |
|---|---|---|
| Revenue | 50.9 | 55.4 |
| COGS | 4.6 | 5.0 |
| Net Sales | 46.3 | 50.1 |
| Margin | 91% | 91% |
| R&D | 22.7 | 23.1 |
| Marketing | 7.4 | 8 |
| Sales | 21.2 | 22.9 |
| G&A | 2.9 | 3.8 |
| Total OpEx | 54.2 | 57.8 |
| Net Profit | -7.9 | -7.3 |
| Profit Margin | -16% | -13% |
**Value Delivery Economics**
| Previous | Current | |
|---|---|---|
| Items Delivered | 3,131 | 5,002 |
| Lead Time | 88 | 37 |
| Cost Per Item Delivered | 7,250 | 4,617 |
They combed through the financials and productivity metrics to figure out what had happened. The value delivery system had become much more efficient. The cost per item delivered decreased. What went wrong? They circled back to where they started with the sales team to ask for an update. The sales team reported that they still felt like speed on delivering customer requests was moving slowly. It had gotten a little bit better in a few areas, but overall it was having a nominal impact on fixing the problem of declining up-sell rates. Determined to get to the bottom of things, the working group decides to dig a bit deeper into the kind of work flowing through the R&D value stream.
This is what they discovered upon further investigation into the breakdown on types of work items R&D was delivering:
| Q2 | Q3 | Q4 | Q1 | |
|---|---|---|---|---|
| Feature | 63% | 46% | 38% | 44% |
| Defect | 13% | 22% | 29% | 36% |
| Technical Debt | 24% | 32% | 33% | 20% |
A light bulb clicked. No wonder the sales team felt like things were moving slowly. The amount of new value being delivered to customers was near an all-time low. It was certainly better than the previous quarter thanks to the improvement in lead time, but this trend was concerning to the group.
As they followed the same path from the first time around, they connected with the R&D team to ask questions. After presenting the work item breakdown by type, R&D was not surprised at all. They look at this ratio quite often. When the group asked them why they hadn't surfaced this earlier, they explained that the pace of constant feature prioritization over the last several years gave the team little extra time to refactor parts of the codebase that were critical to the value delivery system.
In continuing to listen intently, the team conveyed that they had brought this up on several occasions. Upper management insisted that the team focus on creating new value to fuel the growth targets set by the company leaders. The team also explained that because the company has SLAs with customers, they have had to prioritize severe defects over new features; leaving little time for anything else.
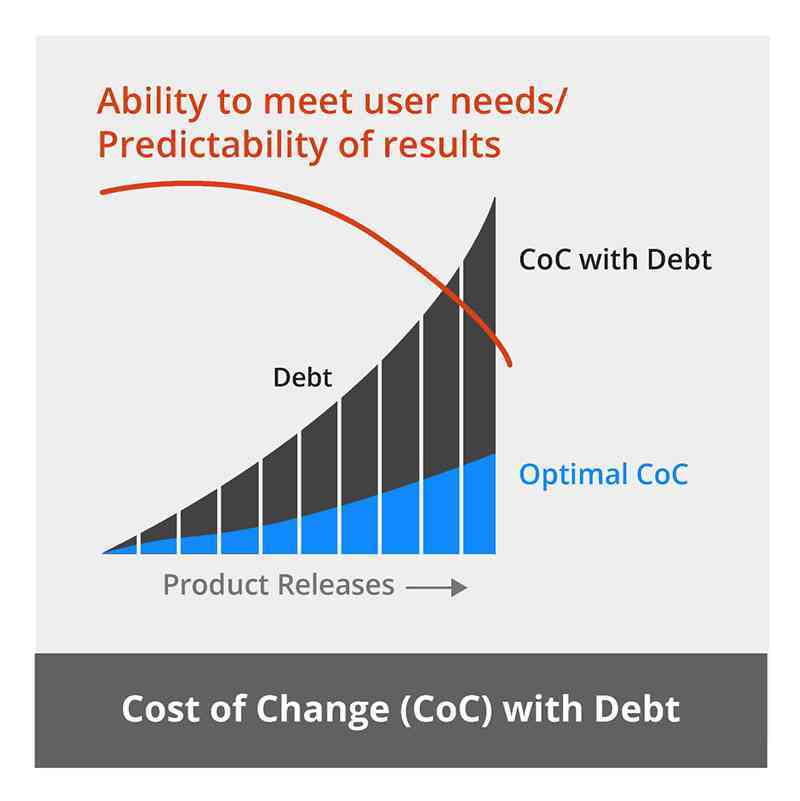
A product manager stepped forward and openly confessed that he regularly makes pacts with his engineering manager to repay technical debt in short order if they would do whatever it took to get the feature shipped. He said they rarely followed through to go back and clean up technical debt. Everyone in the meeting confirmed that this was an acceptable practice. The working group started to see the long term consequences that are so easily masked by strong financial growth. As the R&D team cut corners to ship features, technical debt mounted. Unable to take the time to address it, defect count had started increasing at a consistent rate. The R&D team now had to split focus across three different areas - trying to keep the lights on, delivering new value, and trying to find time to repay the technical debt.
Despite this revelation, the working group was still responsible for delivering on their target condition. Now it was on them to convince leadership to take technical debt seriously. As they mulled over ways to present this, they asked for a report of all the inventory that was waiting to be produced. For this to resonate with the executives, they needed to communicate it in a way that provided justifiable business reasons to throttle back on feature development. They calculated the cost per quarter that the company was spending on work that did not add intrinsic customer value or positively reinforce the Value Exchange System.
| Type | Quarterly Cost | |
|---|---|---|
| Features | 38% | 8.8 |
| Defects | 22% | 5.1 |
| Tech Debt | 40% | 9.2 |
The company was investing $14.3 million in activities that did not have any tangible impact on driving revenue growth. This was something the leadership team could not ignore. As they presented their case, the executives were concerned that slowing down on feature development in any way would adversely impact revenue growth. The working group talked around this by helping them understand that slowing down for a little bit right now would enable them to accelerate much faster as they would be able to more than double their investment in value-adding features once defects and technical debt were in check. The leadership agreed to the working group's proposal.
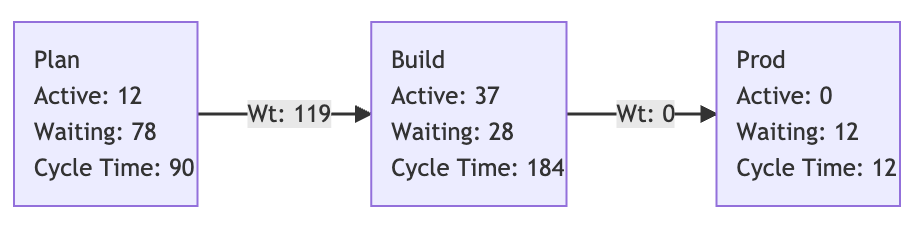
Over the next few quarters, R&D invested heavily in paying down technical debt and reducing defects. They also made optimizations to the value stream and were able to replace both the staging and canary environments by deploying directly to production behind feature flags. Product managers were able to test things out in production and as soon as a feature was ready for release, they clicked a button and it would become incrementally available to everyone. New defects were at an all-time low and the team was confident all of the efforts would produce huge dividends.
The working group double-checked the value stream in anticipation of reviewing the quarterly financials that contained the first full quarter where the team spent 80% of their time on value-adding features.
Value Delivery Economics
| W/ Tech Debt | 80% Features | |
|---|---|---|
| Items Delivered | 5,002 | 11,467 |
| Lead Time | 37 | 11.9 |
| Cost Per Item Delivered | 4,617 | 2,014 |
They were pleased with their value stream. It was fine-tuned, waste-free, and incredibly efficient. Leads times were hovering around 286 hours (11.9 days). The company had continued to invest in scaling the R&D team and they were able to churn out an astonishing 11,467 work items. But then came the financials.
| W/ Tech Debt | Paying It Down | 80% Features | |
|---|---|---|---|
| Revenue | 55.4 | 57.7 | 68.04 |
| COGS | 5.0 | 5.2 | 6.1 |
| Net Sales | 50.5 | 52.5 | 61.9 |
| Margin | 91% | 91% | 91% |
| R&D | 23.1 | 25.3 | 27.2 |
| Marketing | 8 | 8.9 | 9.6 |
| Sales | 22.9 | 24 | 25.6 |
| G&A | 3.8 | 5.1 | 6.4 |
| Total OpEx | 57.8 | 63.3 | 68.8 |
| Net Profit | -7.3 | -10.8 | -6.9 |
| Profit Margin | -13% | -19% | -10% |
They only improved revenue growth rates by 9 points, from 9% to 18%. The working group was surprised the CFO hadn't called. When they checked their calendars, a week-long onsite meeting had been scheduled with heads from every division at the company. It wasn't all too surprising. They continued to fail to meet the mark, but could not figure out why. The cost per work item had been reduced by 72%. Investment in value-adding work items was at an unprecedented all-time high. The value delivery stream was a well-oiled machine, but growth rates weren't responding.
As the working group prepared to meet their fate, they decided to conduct a retrospective to try to gain an understanding of where they went wrong. During the conversation, one of the group members reminded the team of the earlier conversation with R&D discussing success metrics; where R&D recounted that Acme had never really figured out how to more formally tie business outcomes to the output they were creating. The group didn't know the answer, but they agreed to spend some time before the on-site to explore the topic.
The group talked to peers at other companies and read as many books as they could get their hands on. One of them was The Goal by Eliyahu Goldratt, a story much similar to the journey that the working group had been on. As the group discussed the book, they finally realized the fatal flaw they had made -- they had spent all of their time fixated on trying to achieve the local maximum of R&D instead of aligning the feedback loops between the value delivery system and the value capture system.
The most effective way to do this is by focusing on the efficiency of the Value Exchange System as a whole. As the group learned, this can be accomplished by measuring the Value Exchange System's throughput. It's important to note that this kind of throughput should not be confused with the definition in Kanban (work output), but rather the rate at which a system generates revenue through sales. The group had achieved a new level of alignment...almost. To start measuring this, they first needed to learn more about throughput accounting.
Throughput Accounting 101
“The most marvelous characteristic of some complex systems is their ability to learn, diversify, complexify, and evolve…Like resilience, self-organization is often sacrificed for purposes of short-term productivity and stability. Productivity and stability are the usual excuses for turning creative human beings into mechanical adjuncts to production processes.” -- Thinking In Systems
In stark contrast to cost-based accounting, throughput accounting prioritizes value creation over cost-cutting. It consists of three primary metrics:
- Throughput is the rate at which monetizable value is generated from a company's customers over their lifetime minus any variable costs such as the cost of customer acquisition.
- Inventory represents all of the money a company has invested into the Value Exchange System including current product capabilities, unfinished goods (requirements, features, job stories, etc.), equipment, and infrastructure.
- Operating Expenses are the costs expended turning inventory into throughput. This includes research and development, sales, and general expenses.
These metrics are then built up to determine the financial health of a given Value Exchange System:
- Throughput (T) = Lifetime Value (LTV) - Cost of Customer Acquisition (COCA)
- Profit (P) = Total Throughput (T) - Operating Expenses (OE)
- Return On Investment (ROI) = Profit (P) / Inventory (I)
Here is where the differences between cost-based accounting and throughput accounting start to manifest. As Ash Maurya, points out in Scaling Lean:
Cost-based accounting places more emphasis on the right-hand side of the profit equation — decrease operating expenses. It focuses on scalable efficiency and squeezing out costs — especially labor costs. This typically manifests itself as policies requiring detailed weekly timesheets broken down by task, as well as downsizing, outsourcing, and other cost-reducing measures.
It is much more powerful to try to affect the left-hand side of the profit equation — increase throughput — because cost-cutting has a theoretical limit of zero. Increasing throughput has no theoretical upper limit. You can find ways to add more value to an existing product, build more add-on products, or expand the market — provided, of course, that these efforts lead to a positive return on investment.
What's also important about looking at the Value Exchange System through the lens of throughput accounting is that it provides the preferred order for where to focus optimization efforts:
- Throughput
- Decreasing inventory
- Reducing operating expenses
The Universal Goal
As Eliyahu Goldratt, creator of throughput accounting and author of The Goal, frames it:
The universal goal of every business is to increase throughput while minimizing inventory and operating expenses provided doing that doesn't degrade throughput
The working group was starting to think differently. Throughput accounting provides a simple, but powerful decision support framework. Every target condition should map to one of three desired outcomes in the Value Exchange System - increase throughput (T), reduce investment (I), or reduce operating expenses (OE). It's also important to point out that throughput accounting does not use the balance sheet to stash deferred expenses to be realized later. This is a practice that many companies use to manipulate the income statement depending on the kind of story they want to tell. This ultimately masks the true health of the Value Exchange System.
While excited about what they are learning, the working group was still a bit stumped about how to implement it within Acme in a way that would help drive improved revenue growth and profitability. They weren't able to formalize a proposal in time for the onsite, but they were now equipped with some better data points around why they had failed and planned to share the news with the executive group.
Continue reading:
- Part 1: A Gentle(ish) Introduction
- Part 2 : Reduce Waste To Increase Flow
- Part 3 (Next): The Compounding Value Of Shorter Feedback Loops
Giving credit where it is due: Throughput Accounting and the Theory Of Constraints was originally pioneered by Eliyahu Goldratt. Introduced in his book, The Goal, these concepts have revolutionized the way businesses operate.