Published on: September 21, 2016
5 min read
Feature Highlight: Cycle Analytics
See how GitLab's Cycle Analytics can help measure your team's velocity.
On September 22nd, we will release GitLab 8.12 with Cycle Analytics. Cycle Analytics tells you how long it takes your team to go from idea to production on each of their projects.
Few teams can answer how long their software projects take and fewer can answer how long each stage in the process takes. Without this information, you do your best to estimate the time or level of effort that it will take to get from an idea to customer-ready code.
Unfortunately, most teams are flying blind on their estimates using past experiences and best guesses to offer a semblance of how long it’ll take to complete a project. It’s no wonder why estimates are often incorrect.
We built Cycle Analytics to stop blind estimation and instead show you real data on your team’s velocity. You'll see how long the total process takes as well as how much time you spend in each stage.
Why Cycle Analytics Recap
Last week, we wrote a "feature preview" on what Cycle Analytics is and how it can help your team. The TL;DR takeaway from that post was: reducing cycle time is a competitive advantage. Cycle Analytics helps you uncover how long it actually takes to complete your development process. A shared view of the team's velocity is the first stage to improving it.
Measuring the Modern Development Lifecycle

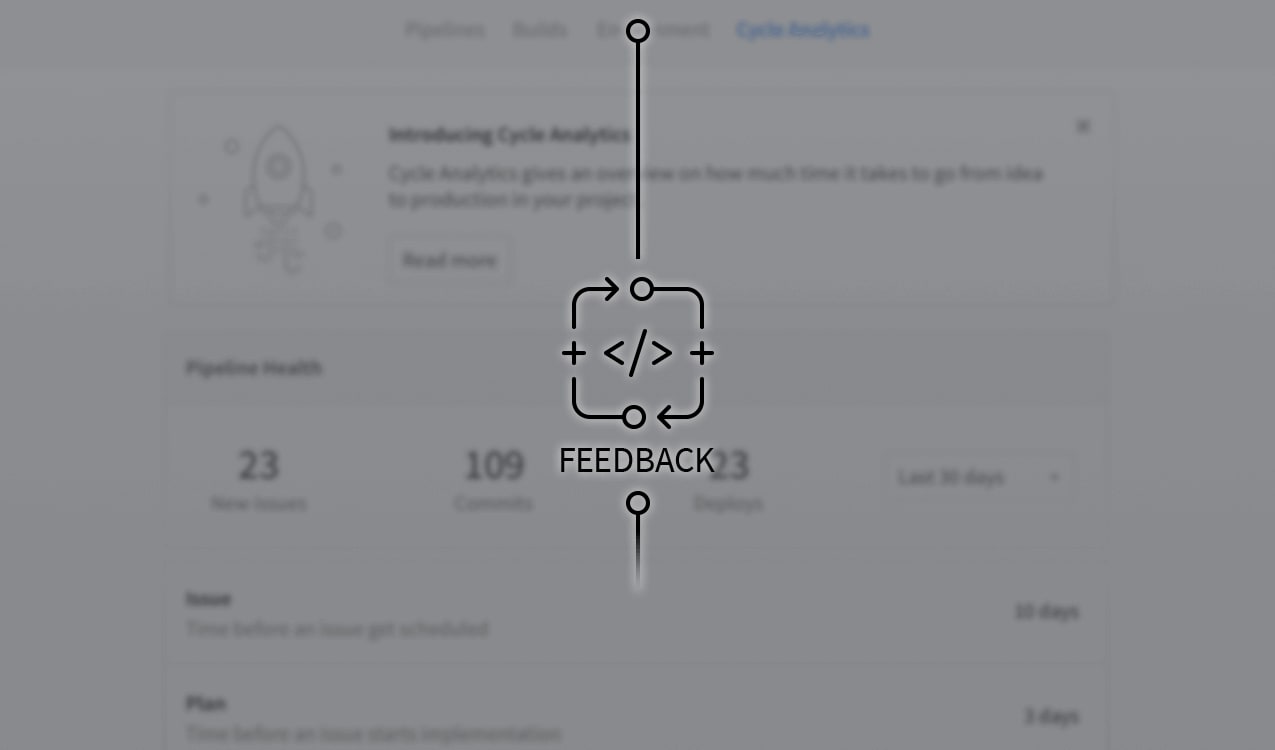
Cycle Analytics tracks the median time it takes your team to complete every stage in the modern development process.
Cycle Analytics Stages
- Issue (Tracker)
- Median time from creating an issue to assigning the issue to a milestone or adding the issue to a list on your Issue Board
- Plan (Board)
- Median time from giving an issue a milestone or adding it to an Issue Board list to the pushing first commit
- Code (IDE)
- Median time from the first commit to creating the merge request
- Test (CI)
- Median of the time CI takes to run every build for the related merge request
- Review (Merge Request)
- Median time from creating the merge request to merging it
- Staging (Continuous Deployment)
- Median time from MR merge until deploy to production
- Production (Total)
- The time it takes between creating an issue and deploying the code to production
Note: This the first iteration of Cycle Analytics. As you know, we ship the smallest thing to provide initial value and then we learn from your feedback and continue to improve the feature over time. We have ideas about what we will build next for Cycle Analytics but we'd love to hear your thoughts. You can follow and contribute to the discussion on this issue.
Cycle Analytics Follows GitLab Flow
In recent months, we've talked a lot about our vision of being an integrated set of tools for the full software development lifecycle. Cycle Analytics is another testament to the benefits of having an integrated toolset. The reason we are able to measure cycle time is because GitLab stores all of the data around your development efforts, and the associated metrics, in one central data store. Now, we're able to surface that data through Cycle Analytics. However, it's important to note that Cycle Analytics tracks cycle time based on the GitLab Flow. Therefore, there are some noteworthy dependencies.
Cycle Analytics & GitLab Flow
- Cycle Analytics is a measure of how long it takes the team to complete the cycle. Therefore, we only track cycle time on issues that have been deployed to production.
- Cycle Analytics uses your GitLab CI configuration file to understand which
environmentis set toproduction. For Cycle Analytics to track your cycle time, you'll need to configure GitLab CI. - The Plan stage measures the time from assigning an issue to a milestone or moving it to a list on the Issue Board to pushing the first commit. For Cycle Analytics to track this time, your commit message must include the issue closing pattern like
Closes #xxx, wherexxxis the issue number related to this commit. - The Code stage measures the time between pushing the first commit and creating a merge request (MR) related to that commit. For Cycle Analytics to track this, you’ll need to add an issue closing pattern like
Closes #xxxto the description of the MR.
We recognize that every team does not follow the same flow. And while GitLab is a flexible product, we are also building an opinionated product that’s aimed at helping you move faster from idea to production. Our CEO, Sid Sijbrandij, shared his thoughts on GitLab Workflow best practices. We hope that they help simplify your workflow within GitLab.
Getting Started
On September 22nd, Cycle Analytics will be available in GitLab.com, GitLab Community Edition, and GitLab Enterprise Edition. Getting started is the same in all three products. All you have to do is navigate to your Project’s Pipelines tab and then select Cycle Analytics to see your project's dashboard.
Keep in mind that if you're working in a new project and you haven't deployed anything to production then you won't see any data on your Cycle Analytics dashboard.
Join Our Release Webcast
Join us on September 29th for our Cycle Analytics and GitLab 8.12 Release Webcast. We'll demo some exciting new features and hold a Q&A. Register here.
More to explore
View all blog posts


We want to hear from you
Enjoyed reading this blog post or have questions or feedback? Share your thoughts by creating a new topic in the GitLab community forum.
Share your feedback