
Our world overwhelms us with information that is more accessible than ever. The increasing rates of content production and consumption are gifts that keep on giving. We can't seem to keep up with the information thrown at us. We're limited by our cognitive limitations and time constraints, and a recent study concluded the result is a shortening of attention spans. Websites are no exception.
Users who interact with your website want feedback, and want it fast. Preferably immediately! Website performance has become an important factor in keeping users engaged. But how do you measure how unresponsive a page is before it becomes fully interactive?
Many performance metrics exist, but this blog post focuses on Total Blocking Time (TBT).
What is Total Blocking Time?
TBT measures the total amount of time tasks were blocking your browser's main thread. This metric represents the total amount of time that a user could not interact with your website. It's measured between First Contentful Paint (FCP) and Time to Interactive (TTI), and represents the combined blocking time for all long tasks.
What is a long task?
A long task is a process that runs on the main thread for longer than 50 milliseconds (ms). After a task starts, a browser can't interrupt it, and a single long-running task can block the main thread. The result: a website that is unresponsive to user input until the task completes.
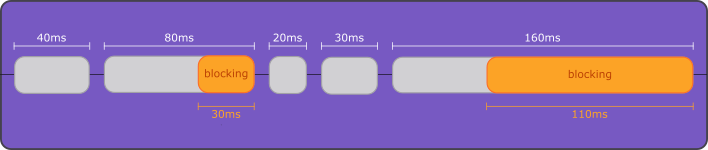
After the first 50 ms, all time spent on a task is counted as blocking time. This diagram shows five tasks, two of which block the main thread for 140 ms:
How can we measure TBT?
Many tools measure TBT, but here we’ll use Chrome DevTools to analyze runtime performance.
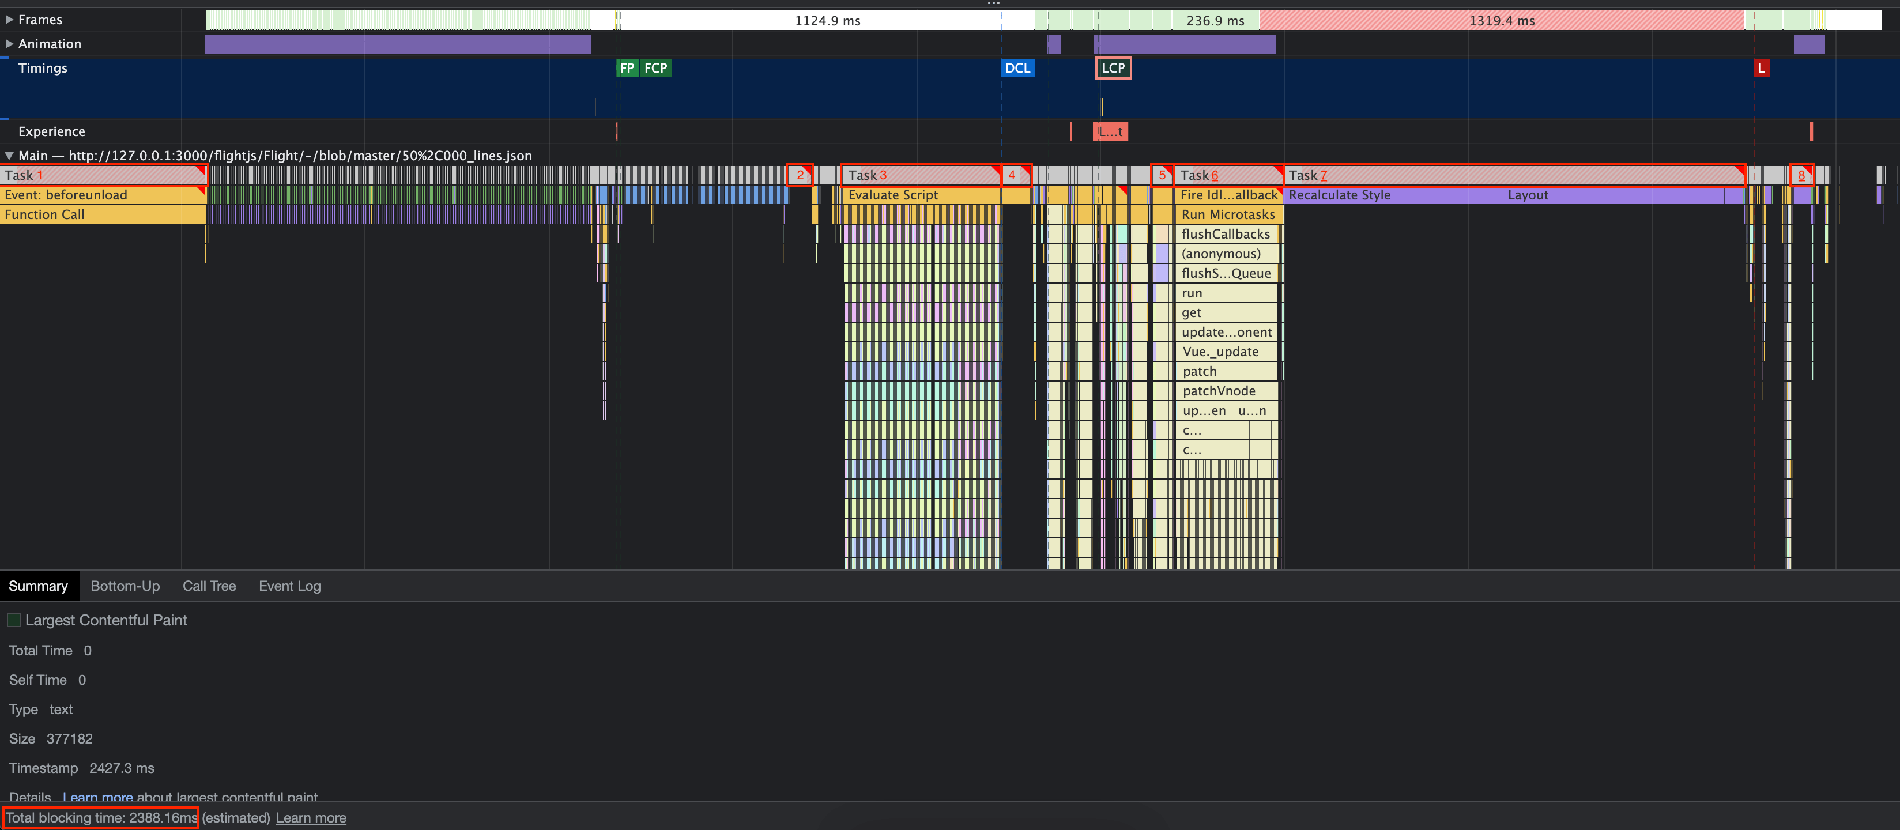
As an example: We recently improved performance on GitLab's View Source page. This screenshot, taken before the performance improvement, shows eight long-running tasks containing a TBT of 2388.16 ms. That's more than two seconds:
How can we improve TBT?
As you might have guessed by now, reducing the time needed to complete long-running tasks reduces TBT.
By selecting one of the tasks from the previous screenshot, we can get a breakdown of how the browser executed it. This Bottom-Up view shows that much time is spent on rendering content in the Document Object Model (DOM):
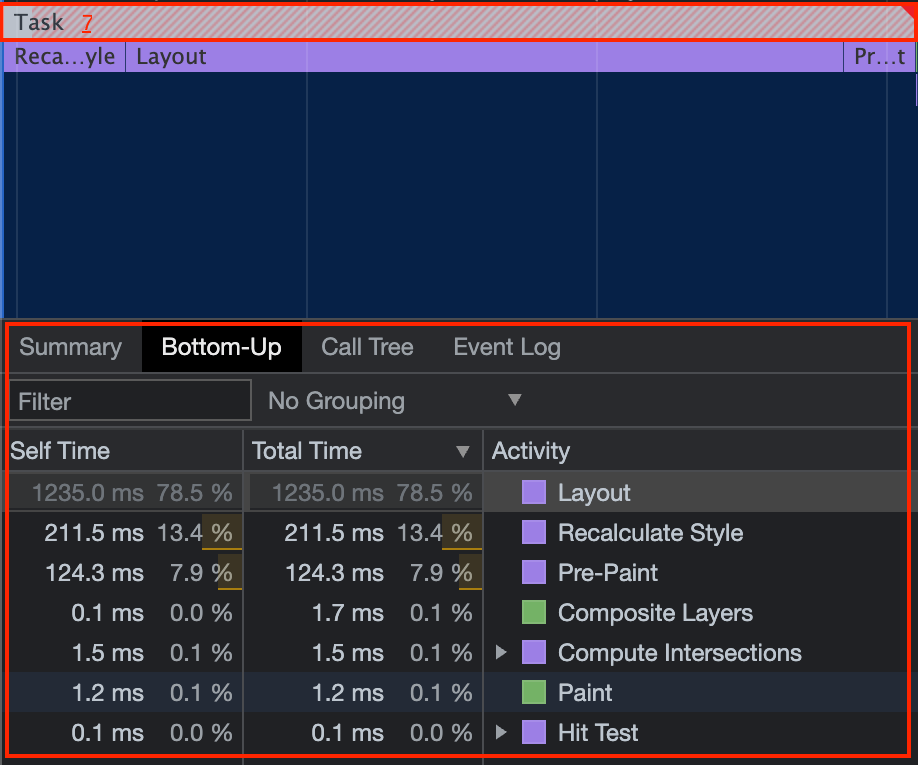
This page has a lot of content that is below the fold – not immediately visible. The browser is spending a lot of resources upfront to render content that is not even visible to the user yet!
So what can we do? Some ideas:
- Change the UX.
- Add a Show More button, paging, or virtual scrolling for long lists.
- Lazy-load images.
(example)
- Lazy-loading images reduces page weight, allowing the browser to spend resources on more important tasks.
- Lazy-load long lists.
(example)
- Similar to lazy-loading images, this approach allows the browser to spend resources on more important tasks.
- Reduce excessive HTML.
(example)
- For example, when loading large pages consider removing unnecessary content. Or, consider rendering some content (like icons) with CSS instead.
- Defer rendering when possible.
- The
content-visibility: auto;CSS property ensures the rendering of off-screen elements (and thus irrelevant to the user) is skipped without affecting the page layout. (example) - The Intersection Observer API allows you to observe when elements intersect with the viewport. This information can be used to show or hide certain elements. (example)
- The global
requestIdleCallbackmethod can be used to render content after the browser goes into an idle state. (example)
- The
Frameworks such as VueJS and React are already heavily optimized. However, be mindful of how you use these frameworks to avoid expensive tasks.
Change VueJS usage to improve TBT
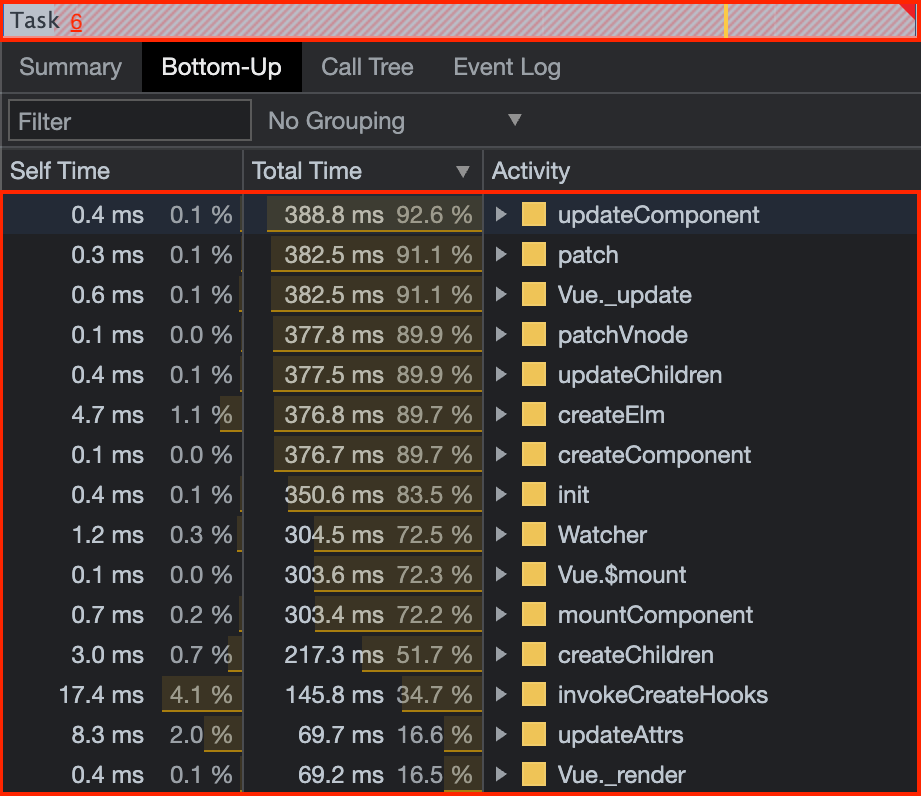
This screenshot shows the Bottom-Up view of a task. Much of the task time is spent on activities from third-party code in the VueJS framework:
What improvements can we make?
- Use Server-side rendering (SSR) or streaming for pages that are sensitive to page load performance.
- If you don't need Vue, don't use it. Component instances are a lot more expensive than using plain DOM nodes. Try to avoid unnecessary component abstractions.
- Optimize component props. Child components in Vue update when at least one of their received props are being updated. Analyze the data that you pass to components. You may find that you can avoid unnecessary updates by making changes to your props strategy.
- Use v-memo to skip updates.
- In Vue versions 3.2 and later,
v-memoenables you to cache parts of your template. The cached template updates and re-renders only if one of its provided dependencies changes.
- In Vue versions 3.2 and later,
- Use v-once for data that does not need to be reactive after the initial load.
(example)
v-onceensures the element and component are only rendered once. Any future updates will be skipped.
- Reduce expensive tasks in your Vue components.
Even a small script may take a long time to finish if it’s not optimized enough. Some suggestions:
- By using
requestIdleCallbackyou can defer the execution of the non-critical tasks. (example) - By executing expensive scripts in WebWorkers you can unblock the main thread.
- By using
Results and methods
By using three of the methods suggested above, we reduced TBT from about 3 seconds to approximately 500 ms:
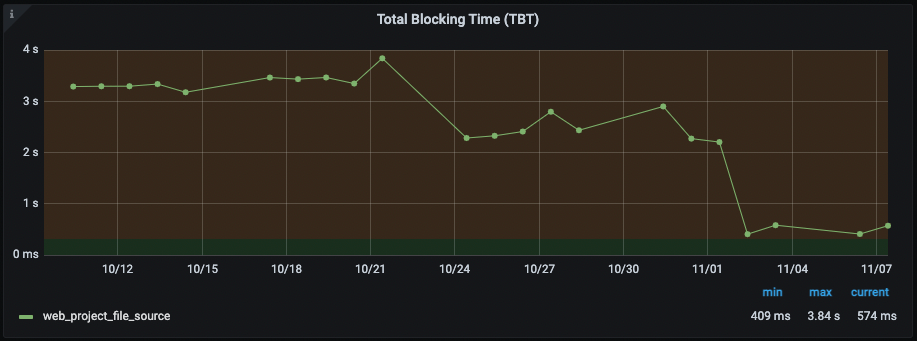
What did we do?
- Deferred rendering by using the
content-visibility: auto;CSS property. - Deferred rendering by using the Intersection Observer API.
- Used v-once for content that didn't need to be reactive after rendering.
Remember, the size of the decrease always depends on how optimized your app already is to begin with.
There is a lot more we can do to improve TBT. While the specific approach depends on the app you're optimizing, the general methods discussed here are very effective at finding improvement opportunities in any app. Like most things in life, a series of the smallest changes often yield the biggest impact. So let's iterate together, and adapt to this ever-changing world.
“Adaptability is the simple secret of survival.” – Jessica Hagedorn


