
A successful DevOps practice relies heavily on metrics. Here at GitLab, we use seven key DevOps metrics to measure engineering efficiency and productivity. Like many teams, we use industry standard metrics, but in some cases, we approach this data with a unique GitLab point of view. Here’s the first in a multipart look at the DevOps metrics we at GitLab think are most critical for success. Compare your metrics and results with ours, and let’s get a conversation started.
Master pipeline stability
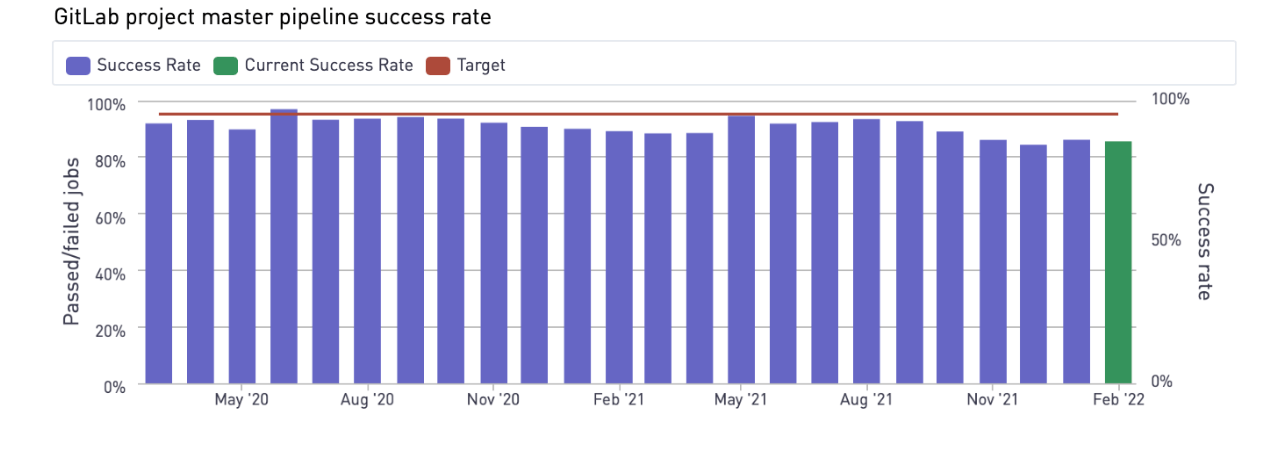
It’s important to be able to measure the stability of the GitLab project’s master branch pipeline. This metric tells us how stable the main branch is, and ensures engineers are checking out code that’s in good shape. Merge trains are key to this effort.
Our target percentage for master pipeline stability is above 95%.
Review app deployment success rate
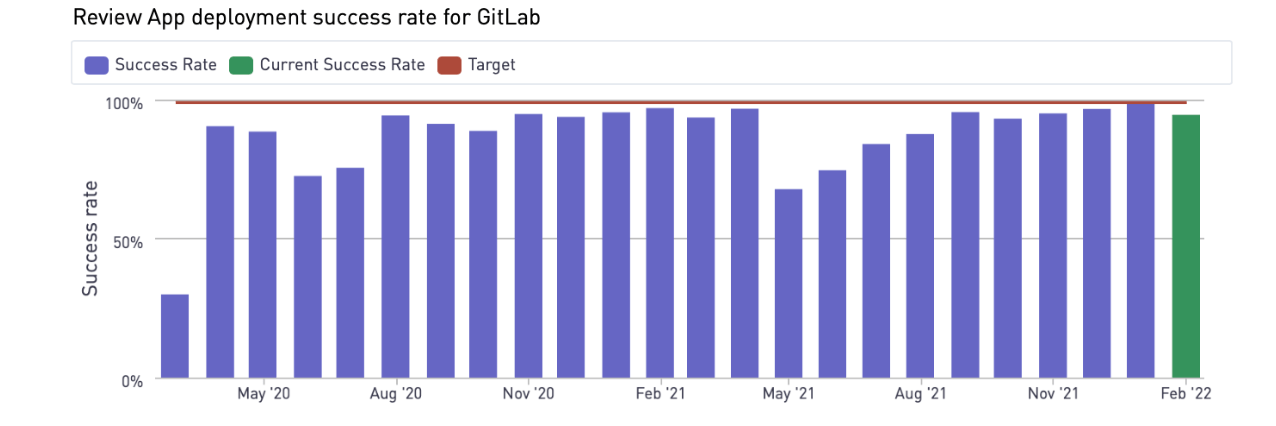
At GitLab we take review apps seriously. We measure their success rate so we can understand the stability of our first deployed environment after code change. Review apps are spun up at MR submission. It’s important to monitor our review app successful deployments because it’s the first place where code is integrated and deployed as one unit. This metric ensures the codebase can be installed, tested, and made available for the team to preview their changes before merging into the main master branch.
Our target for review application deployment success is above 99%.
Time to First Failure
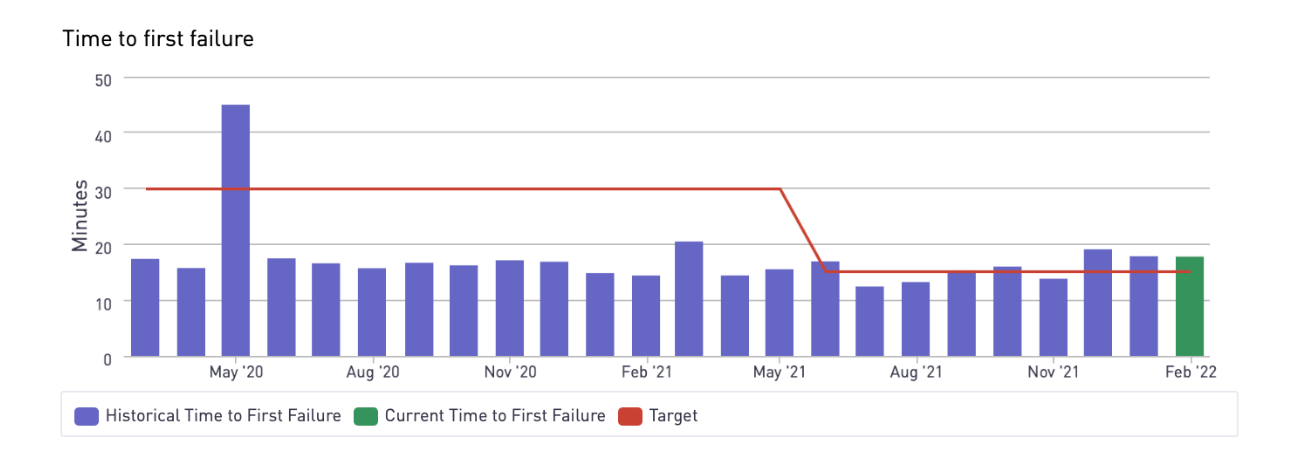
Time to First Failure (TtFF, pronounced as “teuf”) measures how fast we are providing feedback to engineers. This metric examines how long it takes from pipeline creation to the first actionable failed build. The idea is that if the commit is going to fail, it should fail fast and the fail signal should get to the engineers as quickly as possible. The shorter the time to first failure, the faster the feedback loop, and faster time to action to address those failures.
Our TtFF target is less than 15 minutes.
Open S1 bug age
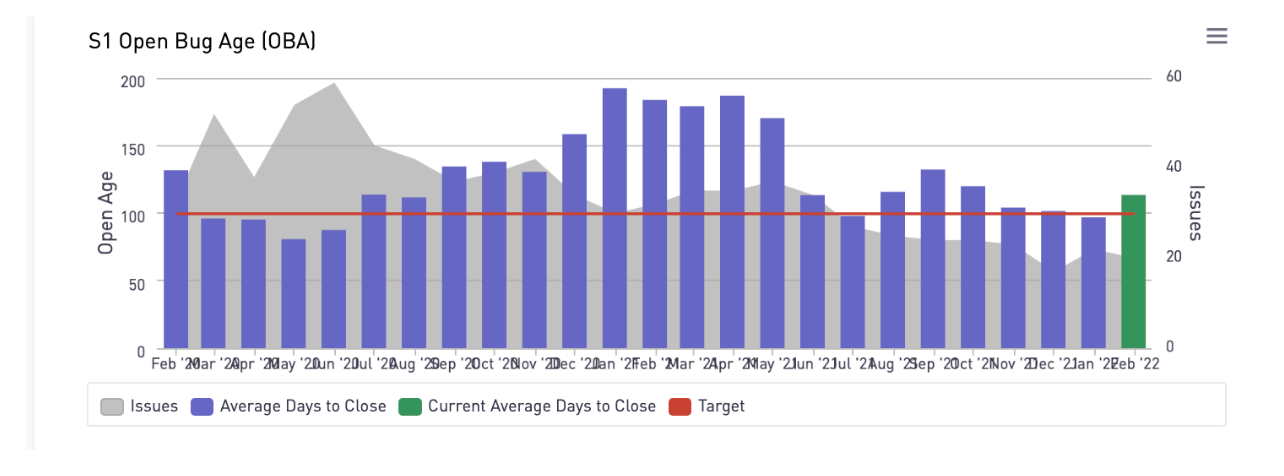
This metric focuses on the age of open S1 bugs. Many organizations measure time to close bugs. At Gitlab we focus on the age of bugs remaining. We structure the metric to focus on work that is remaining and can be actioned on. If we only measure time to close of fixed defects, we may miss addressing older defects and unintentionally incentivize closing of only newer defects. We like to look forward by asking ourselves “What’s left?” and “What can be done now?” rather than only looking backward at what’s already been done.
Our target for S1 open bug age is under 100 days.
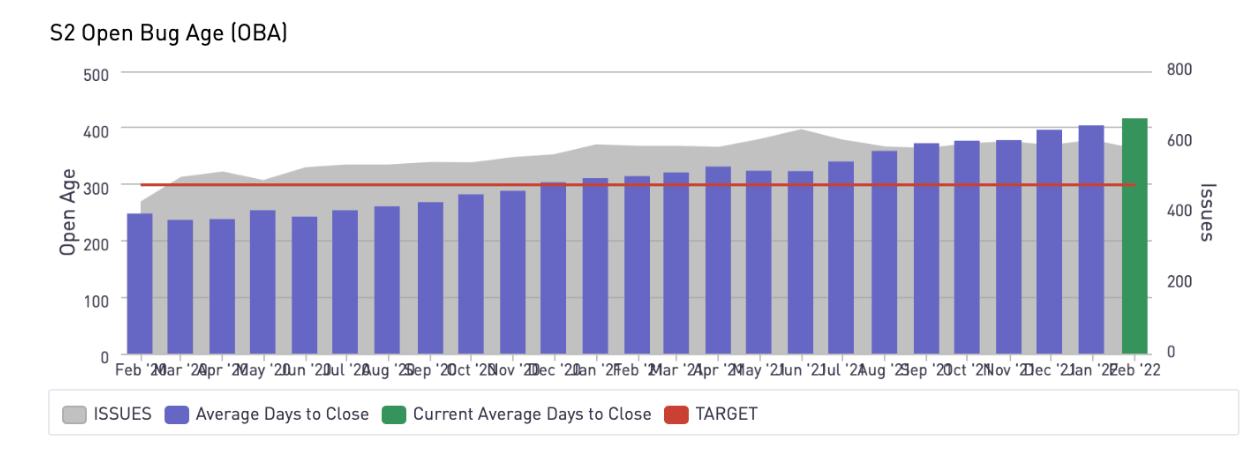
Open S2 bug age
This metric is similar to the open S1 bug age, but is focused on S2 bugs. Again, we measure the age of remaining open bugs rather than focusing on bugs that have been closed.
Our target for the open S2 bug age metric is below 300 days.
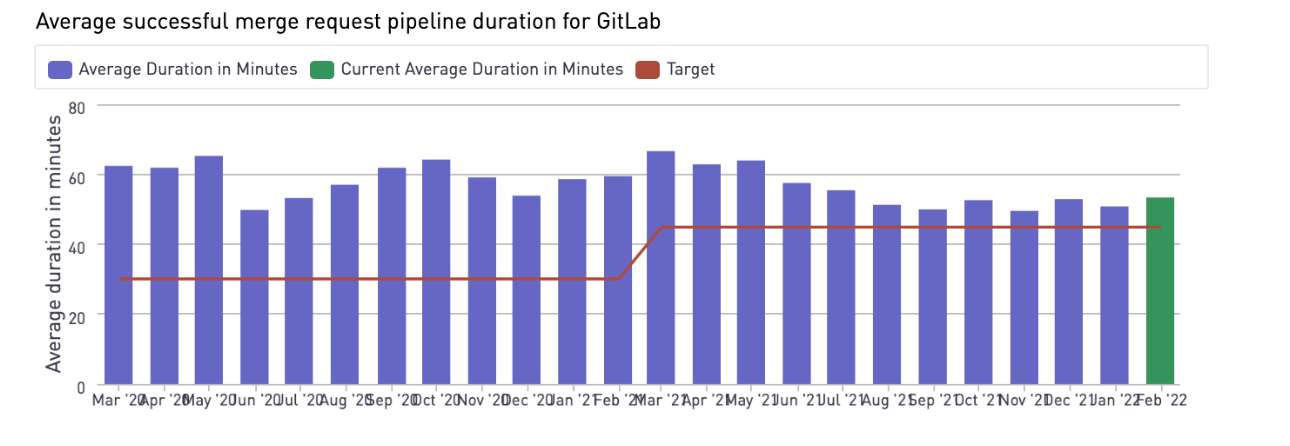
Merge request pipeline duration
When a pipeline is started for a merge request, how long does it take to run? This metric focuses on the duration of merge request pipelines and its time efficiency. Within the total duration we break the data down into multiple stages The team then iterates and improves time efficiencies of each stage of the pipeline. This is a key building block for improving GitLab’s code cycle time and efficiency and ensures the code is merged in a timely manner.
Our target for this metric is below 45 minutes.
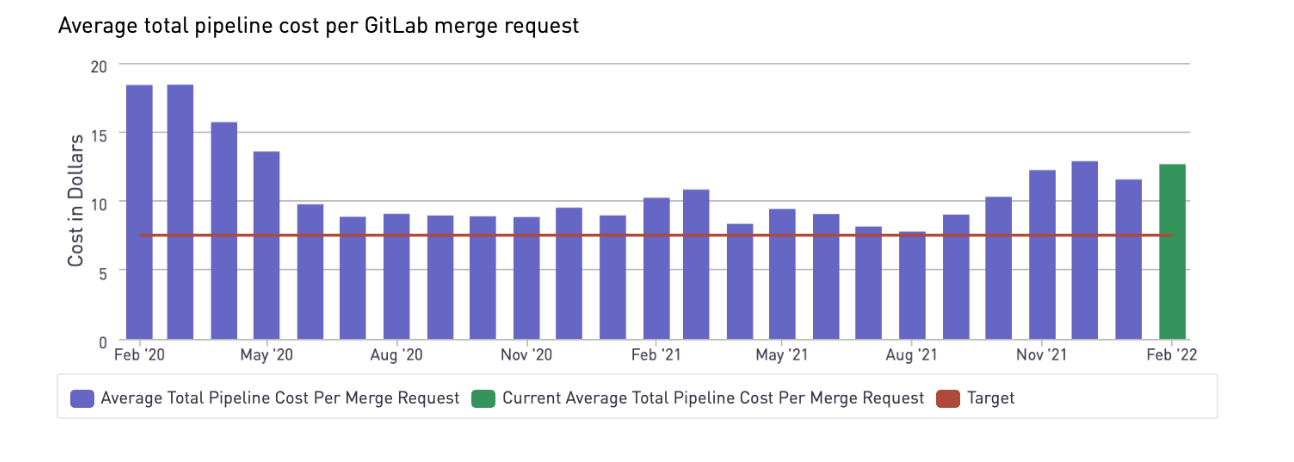
MR pipeline costs
We use this metric at GitLab to help us determine our Merge Request Pipeline cost efficiency. We look at the total costs for the CI runners machines for MR pipelines. Once we’ve determined that figure, we divide it by the number of merge requests. This helps us monitor cost while fine-tuning efficiency. Speed and cost moves in different directions. To help speed up you can increase resources, but it comes at a cost. Monitoring this metric enables us to be balanced and have a healthy trade-off between optimizing for cost and speed.
Our target for the MR pipeline costs metric is below 7.50.
What DevOps tooling metrics are most effective for your team?
We’d like to hear what you think of our choices, and our targets, and what works, or doesn’t, for you. Chime in here.


