
A day in the life of a SRE at GitLab with Laura Montemayor
Hi! I’m Laura Montemayor, a Frontend Engineer in GitLab’s Monitor:Health Group. Monitor is one the DevOps lifecycle stages that comes after you’ve configured your production infrastructure and have deployed your application to it. We work on features that help you monitor metrics and Kubernetes, track errors, manage incidents, and more.
If you’re curious about our team, you can check out our direction page to see what’s on the roadmap.
A few weeks ago, I had the opportunity to shadow our SREs, which was pretty exciting for me, as it is monitoring in action. An SRE is a Site Reliability Engineer, who is responsible for keeping all user-facing services and other GitLab production systems running smoothly.
You can learn all about them in our handbook.
Here are some of my general takeaways from that week:
Less is more when it comes to tooling
I’ve had non-remote friends ask me what communications tools we use at GitLab, and they are sometimes surprised that it’s not a long list. In a way, I had the same expectation for our SREs and their tooling; I had visions of them all buried underneath monitors, with screens showing moving graphs, stats, logs - the works!. But SREs use the same tools everyone at GitLab uses for communication - GitLab issues, Slack and Zoom. The workflow is pretty straightforward; the on-call SRE gets pinged on PagerDuty, which also sends an alert to a Slack channel, and everything is discussed either there or in an issue. True to our transparency value, everyone at GitLab has access to the channels and the issues, and most of these issues are public.
If you are interested in learning more about SREs and the tooling they use (and more!), check out my teammate’s blog post.
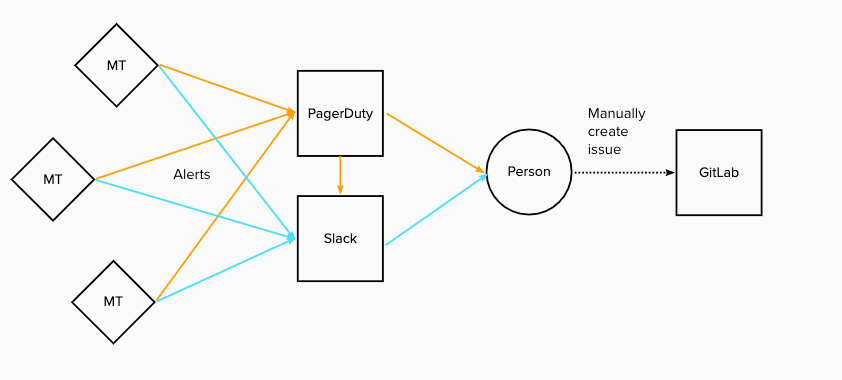
MT = Monitoring Tool
Managing the level of noise is a huge challenge
During the time I shadowed, I probably saw an alert every 5 or so minutes. And this was during their so called “quiet time”! At first, it seems overwhelming to be alerted so often, and everything looked serious and actionable to me. Queue latency outside of SLO? Filesystem will be full SOON? I panicked. However, a lot of these alerts are warnings and don’t all turn into incidents; but even if they are warnings, sometimes they merit some investigation and discussion, since almost no alert can be truly ignored.
Examples of alerts that can usually be ignored:
- CPU/Memory usage that just stepped over 90% - This can be ignored (but an eye should be kept on it) because the prediction algorithms for usage often raise an alert prematurely. The usage normally falls to safe levels or won’t cause an issue for a few more SRE shifts.
- Abuse detection - This can give a lot of false positives which are not necessarily an incident, like abuse being detected when a project’s pipeline is used excessively.
Incidents don’t happen as often as I thought
So even though there are a lot of alerts, I was surprised to find the majority of them don’t actually turn into incidents. There was a part of me who wanted to experience an incident, since I thought going into a situation room and resolving it would be really exciting. But there were only two incidents, and one of them was resolved straight away and the other one was handed over for further investigation. None of them were disruptive to customers though, so all in all, I figure GitLab must be pretty stable 💪
Monitoring is hard (no surprise there!)
Experience and domain knowledge certainly help when it comes to sifting through the noise, but it doesn’t make it easy. A lot of alerts happen because they are often based on inflexible Boolean logic or some arbitrary threshold. For example: we got an alert for a spike in the redis-cache latency Apdex. We checked the Grafana dashboard and realized it was a one off spike in latency, so it was fine for the time being. But it was one more thing to keep an eye out for, and the intermittent spiking kept alerting us, which added more cognitive noise. I can’t even begin to imagine the horror of trying to effectively monitor with a bunch of different tools. This is why I love the idea of a single app for all your needs 😉
Communication is key
One thing that helps immensely with monitoring and incident management is communication. It is one of our core values at GitLab after all, seeing as we are an all-remote, async team. If the SRE who is on-call cannot resolve the issue straight away, they can just ping other SREs on Slack and someone will be available to help. It’s the advantage of being an async team - there’s always someone available in almost every single timezone! It also means that even if you’re not on the SRE team and you’re working on something that will start firing off alerts, you should communicate with the SREs to let them know. For example: some changes were made in the Pages API, which were rolled out to 20% of the domains. This caused an increase in alerts, but since it was properly communicated, the SRE on call could be assured that these alerts were fine to ignore. There was no way of turning these alerts off unfortunately, since the rigidity of the tools doesn’t allow it.
Here’s the issue, if you’re curious.
We love issues 🧡
At GitLab, we love writing everything down in issues, which helps a lot with incident management. Every time an SRE changes shifts, they write a handover issue with a summary of what alerts/incidents are ongoing or resolved, etc. Check out this example. Every time an alert actually becomes an incident, the first step is always to resolve it, since it affects our customers. After that, an issue is created to collaboratively do a root cause analysis and hopefully prevent it from happening again. Keeping record of all of the incidents is really helpful for context and resolution of future incidents.
There must be collaboration
Our SREs who are on-call do not work in isolation, and even though they are the first point of contact for alerts, it’s not expected that they solve everything themselves. Sometimes things can’t be solved in the moment, like the example below.
Incident: AlertManager is failing to send notifications
Why weren’t we able to resolve it? We don’t have visibility when Alertmanager doesn’t
work, as we don’t have logs or graphs to for it.
So what now? We first checked to see if there was a similar or a linked issue, and
there was. After that, we made an issue for it, linked the other issue, assigned a
domain expert, and went from there.
Monitoring is a growing field
Given the imperfect nature of monitoring, it’s only natural that the field is constantly evolving and growing. At GitLab, we recently created a Scalability team, which will help curate our monitoring and alerting. They will frequently update the criteria to generate alerts, which will make the whole process more manageable. My team is responsible for building the features to help monitor and manage incidents, and we’re currently working on features which will help with our SREs workflow. If you’re interested, check out our Ops Section Product Vision for more details. You can also check out the reliability guide for a more in-depth and robust look at what our SREs do.
Join us at GitLab! Or consider trying us out for free.