Accelerated adoption of the cloud requires tools that aid in faster software delivery and performance measurements. Delivering visibility across the value chain, the DORA metrics streamline alignment with business objectives, drive software velocity, and promote a collaborative culture.
Software delivery, operational efficiency, quality - there is no shortage of challenges around digital transformation for business leaders.
Customer satisfaction, a prominent business KPI, has paved the way for experimentation and faster analysis resulting in an increased volume of change in the software development lifecycle (SDLC). Leaders worldwide are helping drive this culture of innovation aligned with organization goals and objectives. However, it is not always about driving the culture alone; it is also about collaboration, visibility, velocity, and quality.
Cloud computing and microservices are driving the cloud-first approach for software delivery, helping to scale them independently, and allowing teams to move faster. But, without DevOps, the team doesn’t have the underlying core to move fast efficiently. DevOps has the power to enable the smallest changes that can have great effects.
This brings us to the question - how do you measure velocity and impact? Or how do you assess quality, and ensure that it is not hampered by velocity? The latter would be what is commonly referred to as technical debt.
A continuous journey needs continuous improvement
Any improvement starts with measurement. Measuring and optimizing DevOps practices improves developer efficiency, overall team performance, and business outcomes. DevOps metrics demonstrate effectiveness, shaping a culture of innovation and ultimately overall digital transformation. In the Accelerate State of DevOps 2021 report by the DevOps Research and Assessment (DORA) team at Google Cloud, which draws insights from 7 years of data collection and research, four metrics are the key to measure software delivery performance.
What are these metrics?
- Deployment Frequency
- Lead time for changes
- Time to restore service
- Change failure rate
Deployment Frequency
Let’s start with the velocity of development. Deployment frequency measures how often the organization deploys code to production or releases it to end users. This metric borrows from lean manufacturing concepts, wherein small multiple batch sizes are the preferred approach for higher efficiency and more rapid adjustments.
Lead time for changes
Now comes the extent of automation in your processes. Lead time for changes measures the time needed to take a committed code to successfully run in production. This is one of the two metrics with significant variance in the data.
Time to restore service
This represents a business' capacity. Time to restore service measures the time needed to restore services to the level they were previously, in case of an incident. Here too we see significant variance in the data.
Change failure rate
And finally, we take a look at quality. Changes which cause a failure in the system – a deployment failure, an incident, a rollback or a remedy – all contribute to measuring the change failure rate.
Driving visibility into the DevOps lifecycle
Recently, Zoopla used DORA metrics to boost deployments and increase automation. Understanding the root cause of their problems helped them make informed adjustments in their process workflows, automation, tools, and more. They recognized the value of using a single platform to overcome roadblocks in velocity and innovation. This brought added visibility into their system which helped improve measurement and analytics.
Our 2021 Global DevSecOps Survey shows engineers are happier when they can focus on innovation and adding value than when maintaining integrations. In fact they would rather focus on higher quality documentation which can further amplify results of investments in DevOps capabilities. Documentation and visibility together drives team performance and competitive advantage.
Visibility driven through DORA metrics can uncover bottlenecks such as a dysfunction in code review, allowing management to identify causes of slowdowns in the DevOps lifecycle, and enable engineering leaders to align with business priorities. This delivers continuous improvement and progress towards business goals, promoting a collaborative culture across the organization.
The team at Zoopla used the GitLab DevOps platform to obtain metrics for deploy frequency, lead time, change fail rate, and time to onboard.
image_title: 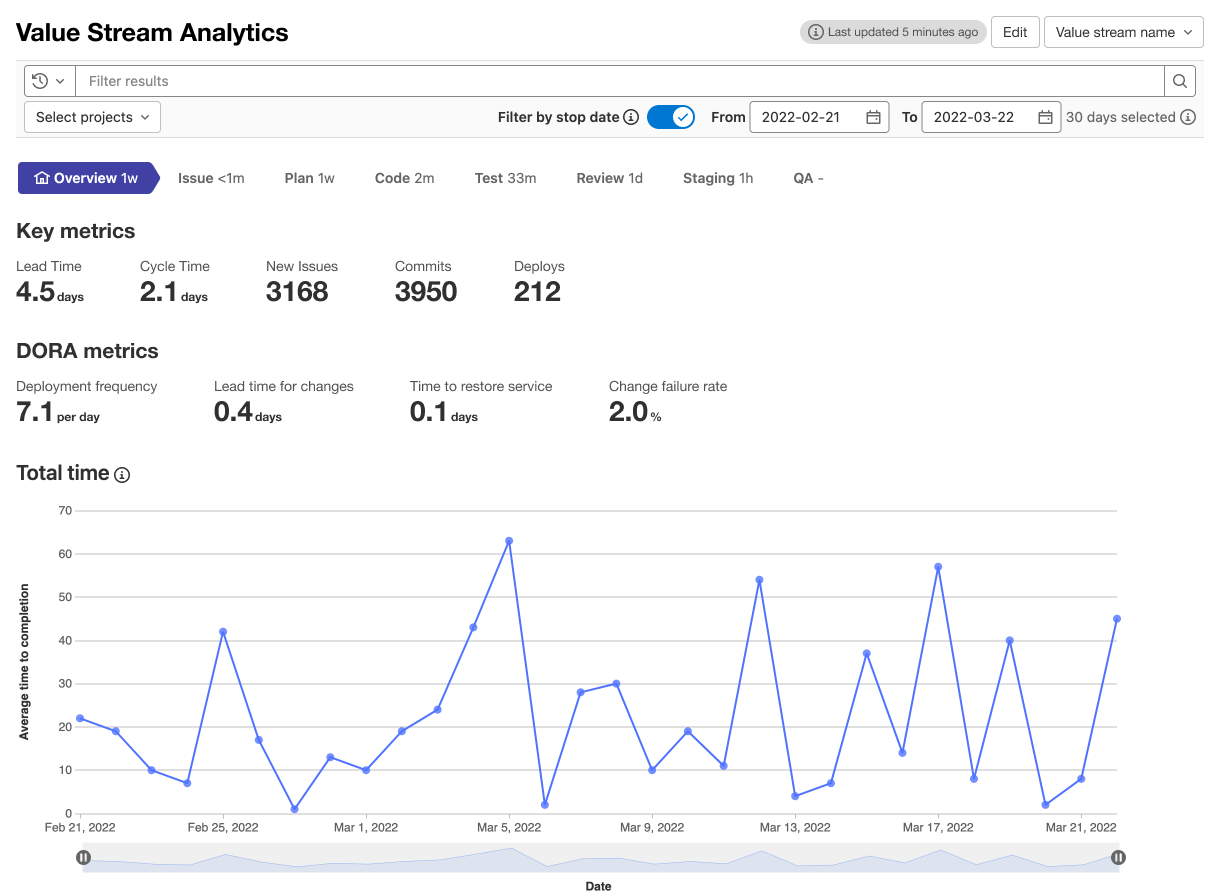
The metrics helped influenced decision making and prioritization at Zoopla. Teams were encouraged to learn from the metrics, and incorporate changes into their planning cycles to keep on the path of continuous improvement. They were successful in measuring improvements and building an efficient engineering team that was flexible in responding to business needs.
[Read more on how Zoopla used DORA metrics for continuous improvement and the DORA metrics API in GitLab]