
When we learned about the Docker Hub Rate Limit, we thought about ways to mitigate and analyse the new situation. Container images are widely used and adopted for sandbox environments in CI/CD pipelines and cloud-native production environments with app deployment in Kubernetes clusters.
What is meant by Docker Hub limits?
Each docker pull request toward the central hub.docker.com container registry is being counted. When a defined limit is reached, future requests are blocked and might be delayed into the next free window. CI/CD jobs cannot be executed anymore after receiving a HTTP error 429 - too many requests and similar errors will be seen in production deployment logs for Kubernetes.
Docker defines this limit with 100 anonymous requests every six hours for the client's source IP address. If you have multiple container deployments behind an IP address, for example a company DMZ using a NAT, this limit can be reached very fast. A similar problem happens with watchtower tools which try to keep your container images updated, for example on your self-managed GitLab Runner. The limit can be raised by logging in, and by getting a paid subscription.
The question is: Where can you see the current limit and the remaining pull requests?
How to check the Docker Hub request limit?
The Docker documentation suggests to use CLI commands which invoke curl HTTP requests against the Docker Hub registry and parse the JSON response with jq.
Define the IMAGE variable once for the following CLI commands to use:
$ IMAGE="ratelimitpreview/test"
Obtain a token for authorization. Optionally print the variable value to verify its content.
$ TOKEN=$(curl "https://auth.docker.io/token?service=registry.docker.io&scope=repository:$IMAGE:pull" | jq -r .token)

$ echo $TOKEN
The next step is to simulate a docker pull request. Instead of using GET as HTTP request method, a HEAD request is sent which does not count toward the rate limit. The response headers contain the keys RateLimit-Limit and RateLimit-Remaining.
$ curl --head -H "Authorization: Bearer $TOKEN" https://registry-1.docker.io/v2/$IMAGE/manifests/latest
The limit in the example is 2500 with remaining 2495 pull requests. 21600 defines the limit time window as six hours.
RateLimit-Limit: 2500;w=21600
RateLimit-Remaining: 2495;w=21600
RateLimit-Reset can be returned too, this will be the remaining time until the limits are reset.
Create a monitoring script
The CLI commands can be turned into a programming language of your choice which provides methods for HTTP requests and better response parsing. The algorithm needs to follow these steps:
- Obtain an authorization token from Docker Hub. Username/password credentials can be optionally provided, otherwise the request happens anonymously.
- Send a
HEADrequest to the Docker Hub registry and simulate adocker pullrequest - Parse the response headers and extract the values for
RateLimit-LimitandRateLimit-Remaining - Print a summary of the received values
A plugin script which can be used by Nagios/Icinga/Sensu/Zabbix and others has additional requirements. It needs to implement the Monitoring Plugins API specification:
- Print the limit and remaining count
- Calculate a state: Ok, Warning, Critical, Unknown and print a helpful text on the shell
- Add optional warning/critical thresholds for the remaining count. Whenever the count is lower than the threshold, the state changes to Warning/Critical and the exit code changes:
OK=0, Warning=1, Critical=2, Unknown=3 - Collect limit values as performance metrics for graphing and visualization
- Add verbose mode and timeout parameters as plugin development best practices. If Docker Hub does not respond within 10 seconds as default, the plugin exits and returns
Unknownas state.
You can download the check_docker_hub_limit.py plugin script and integrate it into your monitoring environment.
Use the monitoring plugin script
The check_docker_hub_limit.py plugin script plugin is written in Python 3 and requires the requests library. Follow the installation instructions and run the plugin script with the --help parameter to see all available options:
$ python check_docker_hub_limit.py --help

usage: check_docker_hub_limit.py [-h] [-w WARNING] [-c CRITICAL] [-v] [-t TIMEOUT]

Version: 2.0.0

optional arguments:
  -h, --help            show this help message and exit
  -w WARNING, --warning WARNING
                        warning threshold for remaining
  -c CRITICAL, --critical CRITICAL
                        critical threshold for remaining
  -v, --verbose         increase output verbosity
  -t TIMEOUT, --timeout TIMEOUT
                        Timeout in seconds (default 10s)
Run the script to fetch the current remaining count. The plugin script exit code returns 0 being OK.
$ python3 check_docker_hub_limit.py
OK - Docker Hub: Limit is 5000 remaining 4997|'limit'=5000 'remaining'=4997

$ echo $?
0
Specify the warning threshold with 10000 pulls, and the critical threshold with 3000.
The example shows how the state changes to WARNING with a current count of 4999 remaining
pull requests. The plugin script exit code changes to 1.
$ python3 check_docker_hub_limit.py -w 10000 -c 3000
WARNING - Docker Hub: Limit is 5000 remaining 4999|'limit'=5000 'remaining'=4999

$ echo $?
1
Specify a higher critical threshold with 5000. When the remaining count goes below this value,
the plugin script returns CRITICAL and changes the exit state into 2.
$ python3 check_docker_hub_limit.py -w 10000 -c 5000
CRITICAL - Docker Hub: Limit is 5000 remaining 4998|'limit'=5000 'remaining'=4998

$ echo $?
2
When a timeout is reached, or another error is thrown, the exit state switches to 3 and the output state becomes UNKNOWN.
Use a Prometheus exporter for rate limit metrics
Prometheus scrapes metrics from HTTP endpoints. There is a variety of exporters for Prometheus to monitor host systems, HTTP endpoints, containers, databases, etc. Prometheus provides client libraries to make it easier to start writing your own custom exporter. The metrics need to be exported in a defined format.
The Docker Hub limit values can be fetched with obtaining an authorization token first, and then sending a HEAD request shown above. The code algorithm follows the ideas of the monitoring plugin. Instead of printing the values onto the shell, the metric values are exposed with an HTTP server. The Prometheus client libraries provide this functionality built-in.
We have created a Prometheus Exporter for Docker Hub Rate Limits using the Python client library. The repository provides a demo environment with docker-compose which starts the exporter, Prometheus and Grafana.
Ensure that docker-compose is installed and clone/download the repository. Then run the following commands:
$ cd example/docker-compose

$ docker-compose up -d
Navigate to http://localhost:3030 to access Grafana and explore the demo environment with the pre-built dashboard.
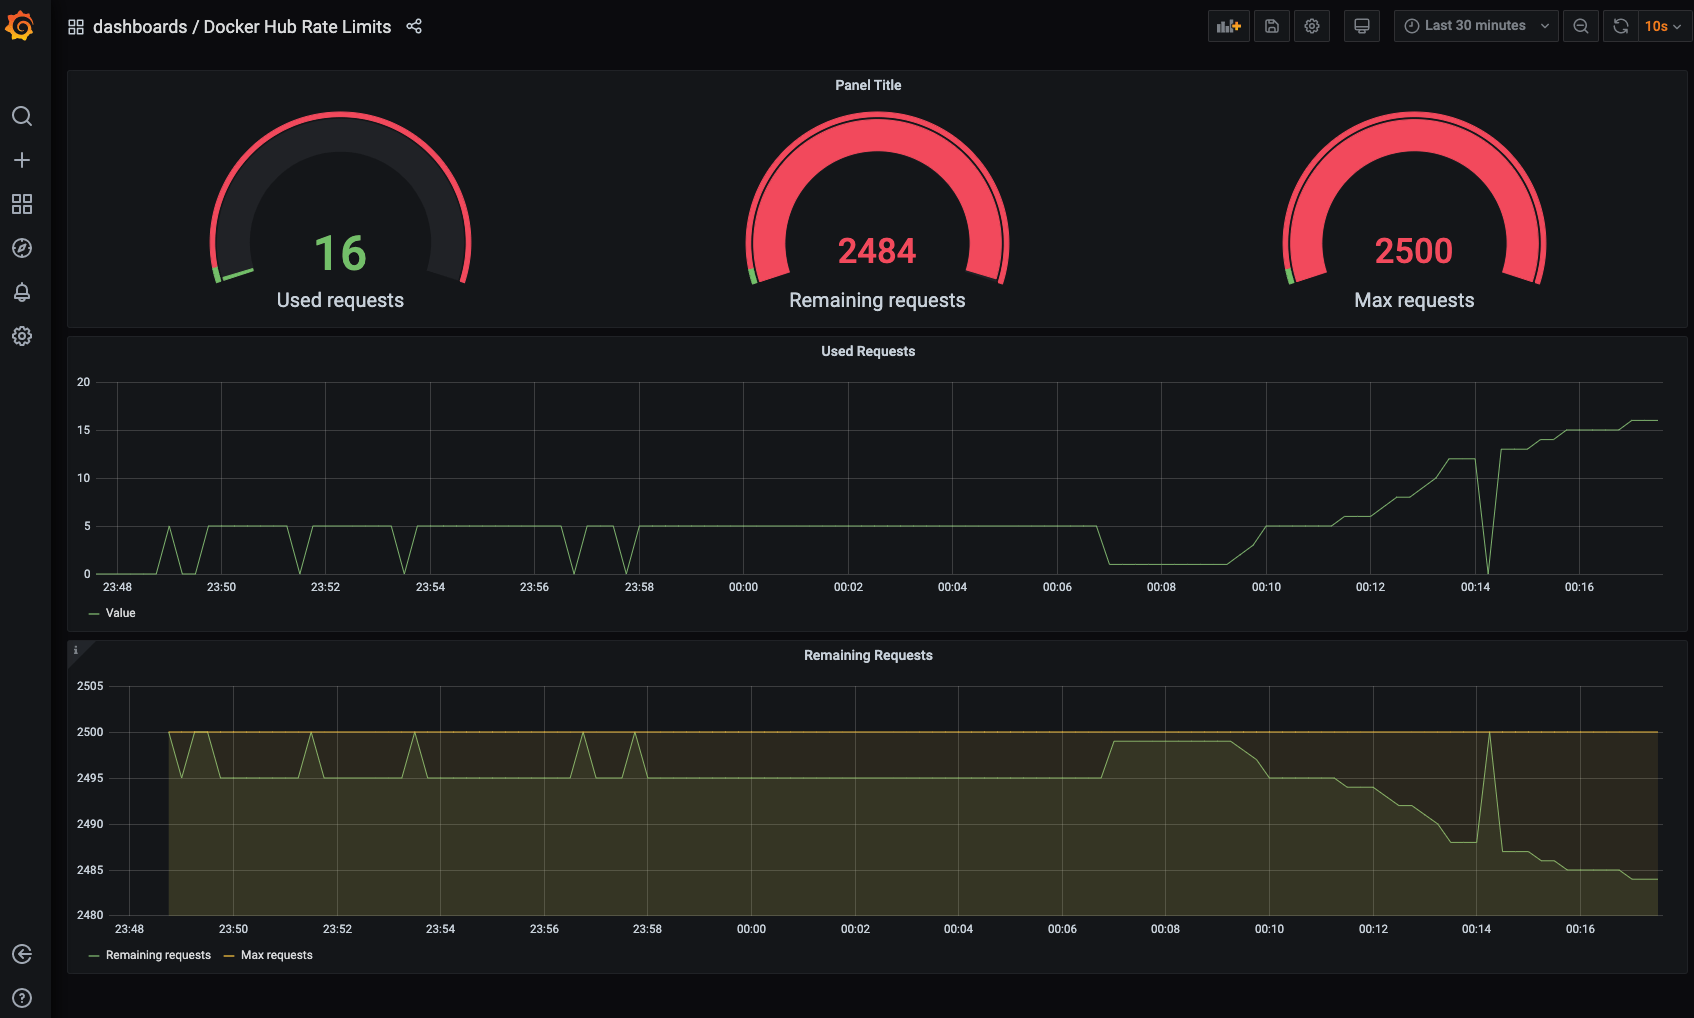
Grafana dashboard for Docker Hub Limits
More monitoring/observability ideas
Use the steps explained in this blog post to add Docker Hub limit monitoring. Evaluate the Prometheus exporter or the check plugin, or create your own monitoring scripts. Fork the repositories and send a MR our way!
The Prometheus exporter and the monitoring plugin script can help to see trends and calculate usage over time. Use your own local (GitLab) container registry or one of the available caching methods described in these blog posts:
- Cache Docker images in your CI/CD infrastructure. Use this resource for possible solutions around caching and proxying.
- Use the Dependency Proxy. Learn more about the GitLab Dependency Proxy being made open source in the future.
- #everyonecancontribute cafe: Docker Hub Rate Limit: Mitigation, Caching and Monitoring. This is a community meetup hosted by Developer Evangelists at GitLab. The blog post includes a video with more insights and discussion.
Photo by Vidar Nordli-Mathisen from Unsplash.


