GitLab has an extraordinary range of features for a single application, providing an entire DevOps platform from portfolio planning all the way through to monitoring and service desk. As such, GitLab is uniquely positioned to deliver a complete picture of your organization's DevOps journey and your return on investment in automation and DevOps practices.
Some of the most interesting and difficult questions that organizations ask themselves are:
- What do we gain from different development practices used by our teams?
- What makes one team more efficient than another?
- What practices have been successful in one team that we can introduce to others?
Analytics
GitLab has several metrics to give you insight into the development lifecycle:
- Application Security - provides a comprehensive set of features for viewing and managing vulnerabilities.
- CI/CD - tracks the history of your pipeline successes and failures, as well as how long each pipeline ran.
- Code Review - displays open merge requests and their review time.
- Insights- allows you to configure custom analytics that will be displayed.
- Issue - illustrates the number of issues created each month.
- Merge Request - displays information that will help you evaluate the efficiency and productivity of your merge request process.
- Repository - displays information such as commit statistics, code coverage, and programming languages used in the repository.
- Value Stream Analytics - measures the time spent to go from an idea to production.
Some analytics are only available for instance-level (self-managed), group level, or project level. Read more about analytics.
These analytics are a great way to see contributions from different projects and groups. On their own, however, they don't give insights into which processes your teams are using. For that, we offer DevOps Reports.
DevOps adoption reports
DevOps Adoption is a DevOps Report located in group-level analytics. It shows you data for how teams in your organization use the most essential GitLab features.
You can use DevOps Adoption to:
- Identify specific subgroups that are lagging in their adoption of GitLab features, so you can guide them on their DevOps journey.
- Find subgroups that have successfully adopted certain features, and could provide guidance to other subgroups on how to use those features.
- Verify if you are getting the return on investment that you expected from GitLab.
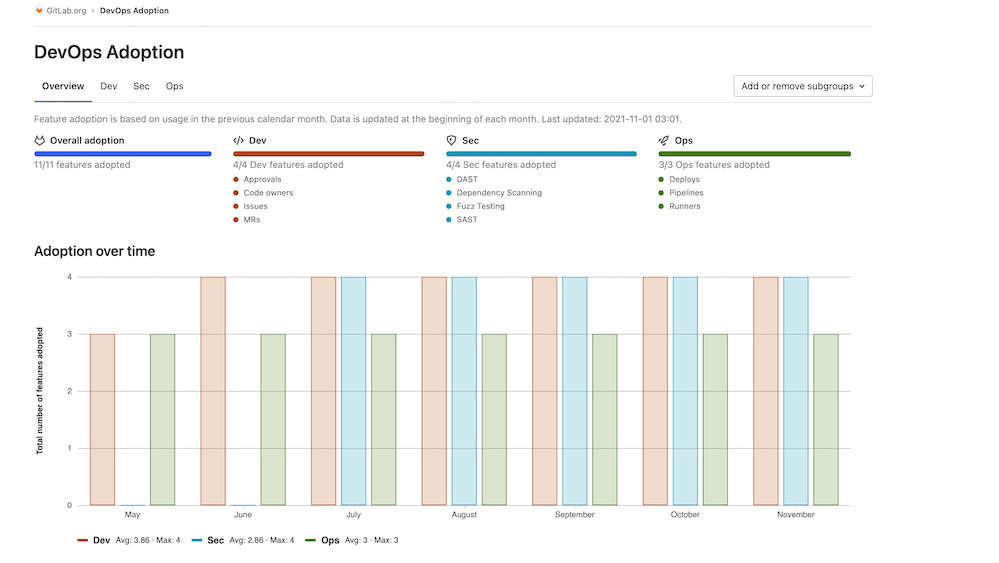
In this example, we can see some interesting data on how a team uses features in development, security, and operations categories:
- Development
- Approvals: At least one merge request approval on a merge request.
- Code owners: At least 1 defined code owner that owns a specific file or repository in the group.
- Issues: At least 1 issue opened in this group.
- Merge requests: At least 1 merge request opened in this group.
- Security
- DAST: At least 1 DAST scan run in a pipeline in the group.
- Dependency Scanning: At least 1 dependency scan ran in a pipeline in the group.
- Fuzz Testing: At least 1 fuzz testing scan ran in a pipeline in the group.
- SAST: At least 1 SAST scan ran in a pipeline in the group.
- Operations
- Deployments: At least 1 deployment.
- Pipelines: At least 1 pipeline ran successfully.
- Runners: At least 1 runner configured for the project or group.
In the future we plan to add even more feature categories to DevOps Reports, such as:
...and much more. You can follow our future plans in the following epic.
DevOps Reports are available for the Ultimate tier for self-managed and SaaS users. To find DevOps Reports, go to your group and in the left sidebar, select Analytics > DevOps adoption
DevOps Score
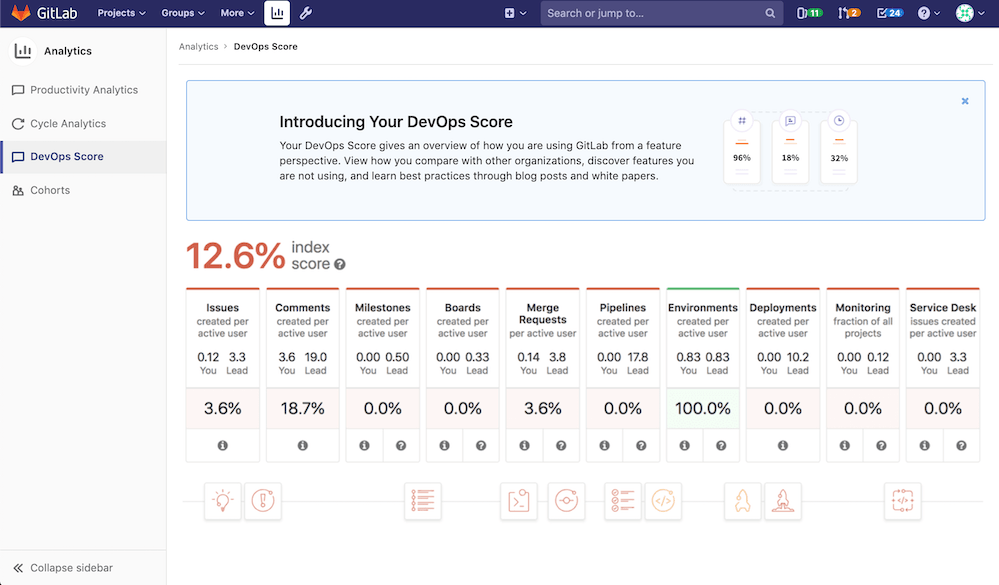
You can use the DevOps score to compare your DevOps status to other organizations.
The DevOps Score tab shows usage of major GitLab features on your instance over the last 30 days. GitLab calculates the averages feature usage based on the number of billable users in that time period. You can also see the Leader usage score, calculated from top-performing instances based on Service Ping data that GitLab collects. GitLab compares your score to the lead score of each feature and shows it as a percentage underneath the feature. Your overall DevOps Score is an average of your feature scores.
To analyze your DevOps Score, GitLab aggregates Service Ping (sometimes referred to as Usage Ping) data on GitLab servers for analysis. Your usage information is not sent to any other GitLab instances. If you have just started using GitLab, it may take a few weeks for GitLab to collect enough data to calculate your DevOps Score.
DevOps score is available at the admin panel for all tiers under Analytics > DevOps Reports.
To see the DevOps score, you must activate your GitLab instance’s Service Ping. This is because DevOps Score is a comparative tool, so your score data must first be centrally processed by GitLab, Inc.
There are several benefits of enabling Service Ping, such as DevOps Score and cohorts:
Cohorts
Cohorts shows your teams' GitLab activities over time, and is a useful tool for administrators to view user retention and manage seats in their GitLab instance.
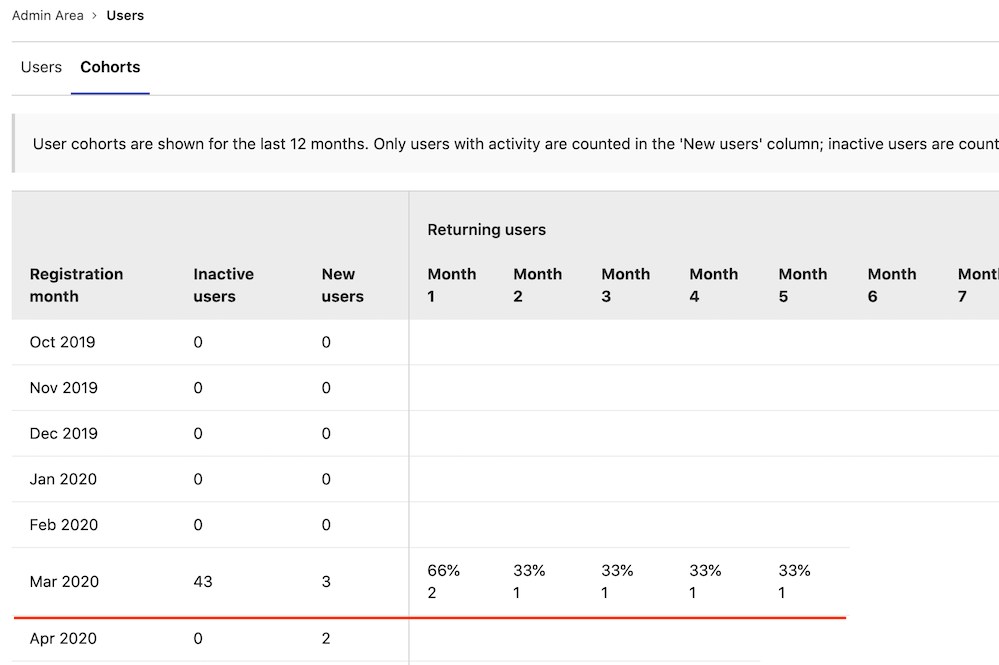
Users are considered active if they have performed at least one of the following activities:
- Sign in to GitLab.
- Perform a Git activity such as push or pull.
- Visit pages related to dashboards, projects, issues, or merge requests.
- Use the API.
- Use the GraphQL API.
Cover image credit:
Cover image by John Schnobrich on Unsplash