Published on: February 25, 2016
16 min read
Making GitLab Faster
In GitLab 8.5 we shipped numerous performance improvements. In this article we'll take a look at some of these changes and the process involved in finding and resolving these issues.

In GitLab 8.5 we shipped numerous performance improvements. In this article we'll take a look at some of these changes and the process involved in finding and resolving these issues. In particular we'll look at the following merge requests:
- Optimize fetching issues closed by a merge request
- Improve performance of retrieving last update times for events
- Only set autocrlf when creating/updating files
Performance Monitoring & Tooling
Without a proper production performance monitoring system and a good set of tools it's nearly impossible to find and resolve performance problems. GitLab comes with two systems to make it possible to measure application performance:
- GitLab Performance Monitoring: a monitoring system using InfluxDB to track application performance of production environments (though you can also use it during development). Data is then visualized using Grafana, though users can use any software capable of extracting data from InfluxDB.
- Sherlock: a development only monitoring system. Due to the overhead of Sherlock it's not suitable for production environments. For example, Sherlock uses rblineprof to track execution timings on a per line basis but this adds quite a bit of overhead.
Another very useful library is benchmark-ips. This library can be used to measure the performance of snippets of code while taking care of warming up any caches, Just In Time compilers, etc. For more information see the benchmark-ips README.
Limitations of Benchmarks
While we're on the topic of benchmarks it's worth mentioning that benchmarks are only really useful to see the impact of a certain change. For example, if benchmark X can run Y iterations in a certain time period this gives you no insight in how this will perform in a production environment; all it indicates is that it can run a certain number of iterations. However, when a certain change results in the benchmark now completing twice as fast things start getting interesting. While we still don't really know how the change will affect our production environment we at least know that in the most ideal case performance will be twice as fast.
In short, just benchmarks aren't enough; you always have to measure (and keep measuring) the performance of code in a production environment. This may seem like common knowledge but a few too many projects out there make bold claims about their performance based solely on a set of benchmarks.
With that out of the way, let's get started.
Optimize fetching issues closed by a merge request
Commit messages can be used to automatically close issues by adding the text "Fixes #X" or "Closes #X" to a commit message (where X refers to an issue ID). In turn each merge request shows the list of issues that will be closed whenever the merge request is merged. The description of a merge request can also include include text such as "Fixes #X" to close issues. In other words, the list of issues to close is a set composed out of the issues to close as extracted from the commit messages and the issues to close as extracted from the merge request's description.
Which brings us to the method MergeRequest#closes_issues. This method is used
to return the list of issues to close (as an Array of Issue instances). If we
look at the performance of this method over time we see the following:
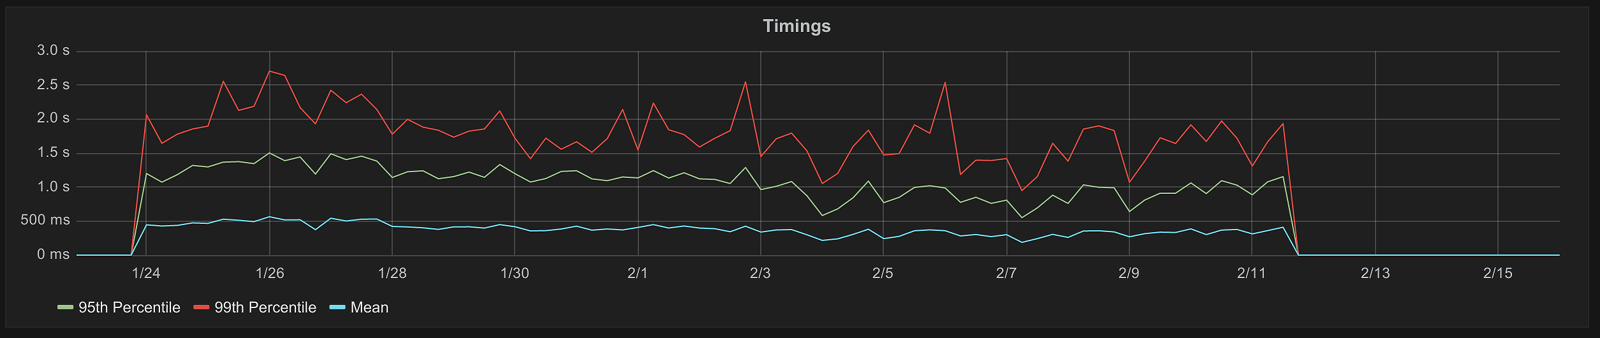
The small gap at the start of the graph is due to monitoring data only being retained for 30 days.
To summarize the timings:
- A mean of around 500 milliseconds
- A 95th percentile between 1 and 1.5 seconds
- A 99th percentile between 1.5 and 2 seconds
2 seconds (in the worst case) to retrieve a list of issues to close is not acceptable so it was clear there was some work to be done.
Prior to 8.5 this method was implemented as the following:
      def closes_issues(current_user = self.author)
   if target_branch == project.default_branch
     issues = commits.flat_map { |c| c.closes_issues(current_user) }
     issues.push(*Gitlab::ClosingIssueExtractor.new(project, current_user).
                closed_by_message(description))
     issues.uniq(&:id)
   else
     []
   end
end
When the target branch of a merge request equals the project's default branch this method takes the following steps:
- For every commit in the merge request, grab the issues that should be closed when the merge request is merged.
- Append the list of issues to close based on the merge request's description to the list of issues created in step 1.
- Remove any duplicate issues (based on the issue IDs) from the resulting list.
What stood out here is the following line:
issues = commits.flat_map { |c| c.closes_issues(current_user) }
For every commit the method Commit#closes_issues would be called, which in
turn was implemented as the following:
      def closes_issues(current_user = self.committer)
  Gitlab::ClosingIssueExtractor.new(project, current_user).closed_by_message(safe_message)
end
Further digging revealed that Gitlab::ClosingIssueExtractor#closed_by_message
would perform two steps:
- Extract the referenced issue IDs from a String
- Run a database query to return a list of corresponding
Issueobjects
Note that the above steps would be performed for every commit in a merge request, regardless of whether a commit would actually reference an issue or not. As such the more commits a merge request would contain the slower things would get.
If we look at how Gitlab::ClosingIssueExtractor#closed_by_message is
implemented and used we see that it operates on a single String and doesn't
really care what it contains or where it comes from as long as it contains
references to issue IDs:
      def closed_by_message(message)
  return [] if message.nil?

  closing_statements = []
  message.scan(ISSUE_CLOSING_REGEX) do
    closing_statements << Regexp.last_match[0]
  end

  @extractor.analyze(closing_statements.join(" "))

  @extractor.issues
end
This got me thinking: what if we concatenate all commit messages together and
pass the resulting String to Gitlab::ClosingIssueExtractor#closed_by_message?
Doing so would mean performance is no longer affected by the amount of commits
in a merge request.
To test this I wrote a benchmark to compare the old setup versus the idea I was going for:
      require 'benchmark/ips'

project = Project.find_with_namespace('gitlab-org/gitlab-ce')
user    = User.find_by_username('yorickpeterse')
commits = ['Fixes #1', 'Fixes #2', 'Fixes #3']
desc    = 'This MR fixes #1 #2 #3'

Benchmark.ips do |bench|
  # A somewhat simplified version of the old code (excluding any actual
  # commit/merge request objects).
  bench.report 'old' do
    issues = commits.flat_map do |message|
      Gitlab::ClosingIssueExtractor.new(project, user).
        closed_by_message(message)
    end

    issues.push(*Gitlab::ClosingIssueExtractor.new(project, user).
               closed_by_message(desc))

    issues.uniq(&:id)
  end

  # The new code
  bench.report 'new' do
    messages = commits + [desc]

    Gitlab::ClosingIssueExtractor.new(project, user).
      closed_by_message(messages.join("\n"))
  end

  bench.compare!
end
When running this benchmark we get the following output:
      Calculating -------------------------------------
                 old     1.000  i/100ms
                 new     1.000  i/100ms
-------------------------------------------------
                 old      1.377  (± 0.0%) i/s -      7.000
                 new      2.807  (± 0.0%) i/s -     15.000  in   5.345900s

Comparison:
                 new:        2.8 i/s
                 old:        1.4 i/s - 2.04x slower
So in this benchmark alone the new code is around 2 times faster than the old code. The actual number of iterations isn't very relevant, we just want to know if we're on the right track or not.
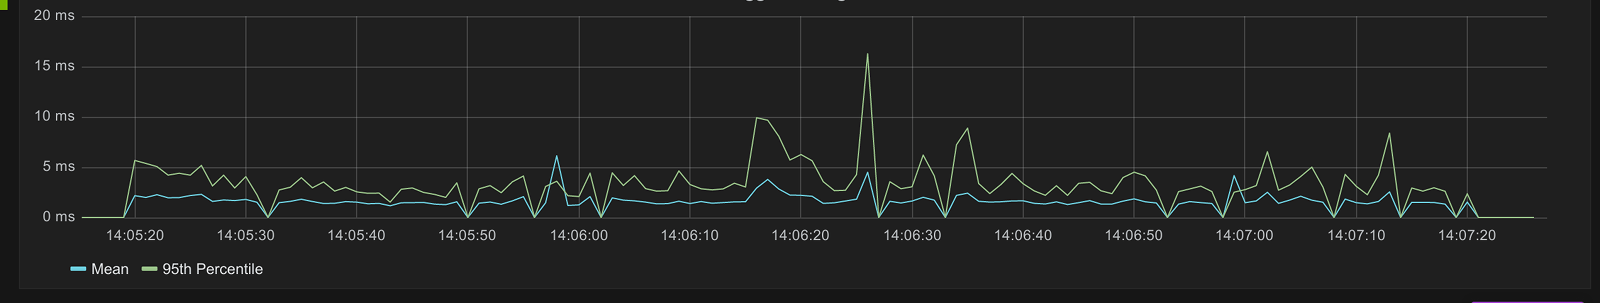
Running the test suite showed no tests were broken by these changes so it was time to set up a merge request and deploy this to GitLab.com (and of course include it in the next release, 8.5 in this case) to see the impact in a production environment. The merge request for this was "Optimize fetching issues closed by a merge request". These changes were deployed around the 12th of February and we can see the impact on GitLab.com in the following graph:
That's right, we went from timings between 0.5 and 2.5 seconds to timings of less than 15 milliseconds (method call timings below 15 milliseconds are not tracked). Ship it!
Improve performance of retrieving last update times for events
For certain activity feeds we provide Atom feeds that users can subscribe to. For example https://gitlab.com/yorickpeterse.atom provides an Atom feed of my public GitLab.com activity. The feed is built by querying a list of records from the database called "events". The SQL query is rather large as the list of events to return is based on the projects a user has access to (in case of user activity feeds). For example, for my own user profile the query would be as following:
      SELECT events.*
FROM events
LEFT OUTER JOIN projects ON projects.id = events.project_id
LEFT OUTER JOIN namespaces ON namespaces.id = projects.namespace_id
WHERE events.author_id IS NOT NULL
AND events.author_id = 209240
AND (
    projects.id IN (
        SELECT projects.id
        FROM projects
        WHERE projects.id IN (
            -- All projects directly owned by a user.
            SELECT projects.id
            FROM projects
            INNER JOIN namespaces ON projects.namespace_id = namespaces.id
            WHERE namespaces.owner_id = 209240
            AND namespaces.type IS NULL

            UNION

            -- All projects of the groups a user is a member of
            SELECT projects.id
            FROM projects
            INNER JOIN namespaces ON projects.namespace_id = namespaces.id
            INNER JOIN members ON namespaces.id = members.source_id
            WHERE namespaces.type IN ('Group')
            AND members.type IN ('GroupMember')
            AND members.source_type = 'Namespace'
            AND members.user_id = 209240

            UNION

            -- All projects (that don't belong to one of the groups of a
            -- user) a user is a member of
            SELECT projects.id
            FROM projects
            INNER JOIN members ON projects.id = members.source_id
            WHERE members.type IN ('ProjectMember')
            AND members.source_type = 'Project'
            AND members.user_id = 209240
        )

        UNION

        -- All publicly available projects, regardless of whether we still
        -- have access or not.
        SELECT projects.id
        FROM projects
        WHERE projects.visibility_level IN (20, 10)
    )
)
ORDER BY events.id DESC;
This particular query is quite the behemoth but currently this is the easiest way of getting a list of events for projects a user has access to.
One of the bits of information provided by an Atom feed is a timestamp
indicating the time the feed was updated. This timestamp was generated using the
method Event.latest_update_time which would take a collection of events and
return the most recent update time. This method was implemented as the following:
      def latest_update_time
  row = select(:updated_at, :project_id).reorder(id: :desc).take

  row ? row.updated_at : nil
end
This method is broken up in two steps:
- Order the collection in descending order, take the first record
- If there was a record return the
updated_atvalue, otherwise returnnil
This method was then used as the following in the Atom feed (here xml.updated
would generate an <updated> XML element):
xml.updated @events.latest_update_time.xmlschema if @events.any?
Performance of this method was less than stellar (the blue bars are the timings
of Event.latest_update_time):
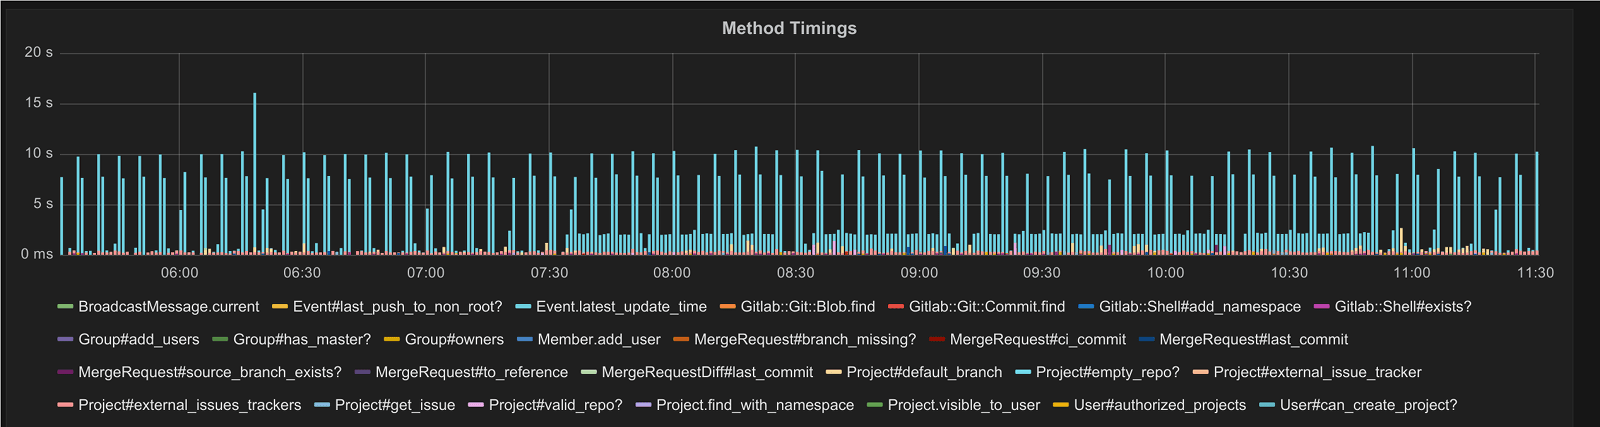
In this graph we can see the timings quite often hover around 10 seconds. That's 10 seconds just to get the latest update time from the database. Ouch!
At first I started messing around with using the SQL max() function instead of
a combination of ORDER BY and LIMIT 1. We were using this in the past and I
explicitly removed it because it was performing worse at the time. Since quite a
bit changed since then I figured it was worth re-investigating the use of this
function. The process of looking into this as well as my findings can be found
in issue 12415.
A couple of days after I first started looking into this issue I realized there was a far easier solution to this problem. Since retrieving the list of events itself (without using the above code) is already quite fast and is already sorted in the right order we can simply re-use this list. That is, we'd take the following steps:
- Query the list of events.
- Cast the list of events from an ActiveRecord query result to an Array (this is done anyway later on as we have to generate XML for every event).
- Take the
updated_atvalue of the first event in this list, if present.
This led to merge request "Improve performance of retrieving last update times for events". This merge request also contains a few other changes so certain records aren't loaded into memory when not needed, but the gist of it is that instead of this:
xml.updated @events.latest_update_time.xmlschema if @events.any?
We now use this:
xml.updated @events[0].updated_at.xmlschema if @events[0]
As a result of this the method Event.latest_update_time was no longer needed
and thus was removed. This in turn drastically reduced the loading times of all
Atom feeds (not just user feeds).
Only set autocrlf when creating/updating files
Git has an option called core.autocrlf which can be used to automatically
convert line endings in text files. This option can be set to 3 values:
true: CRLF line endings are always converted to LF line endingsfalse: no conversion takes placeinput: converts CRLF line endings to LF upon committing changes
GitLab supports 3 ways of committing changes to a Git repository:
- Via a Git client
- Via the web editor
- Via the API
In the last 2 cases we want to make sure CRLF line endings are replaced with LF
line endings. For example, browsers use CRLF even on non Windows platforms. To
take care of this our documentation recommends users to configure Git to set
core.autocrlf to input, however we still need to take care of this ourselves
in case a user didn't configure Git to convert line endings by default. This
process took place in a method called Repository#raw_repository which was
implemented as the following:
      def raw_repository
  return nil unless path_with_namespace

  @raw_repository ||= begin
    repo = Gitlab::Git::Repository.new(path_to_repo)
    repo.autocrlf = :input
    repo
  rescue Gitlab::Git::Repository::NoRepository
    nil
  end
end
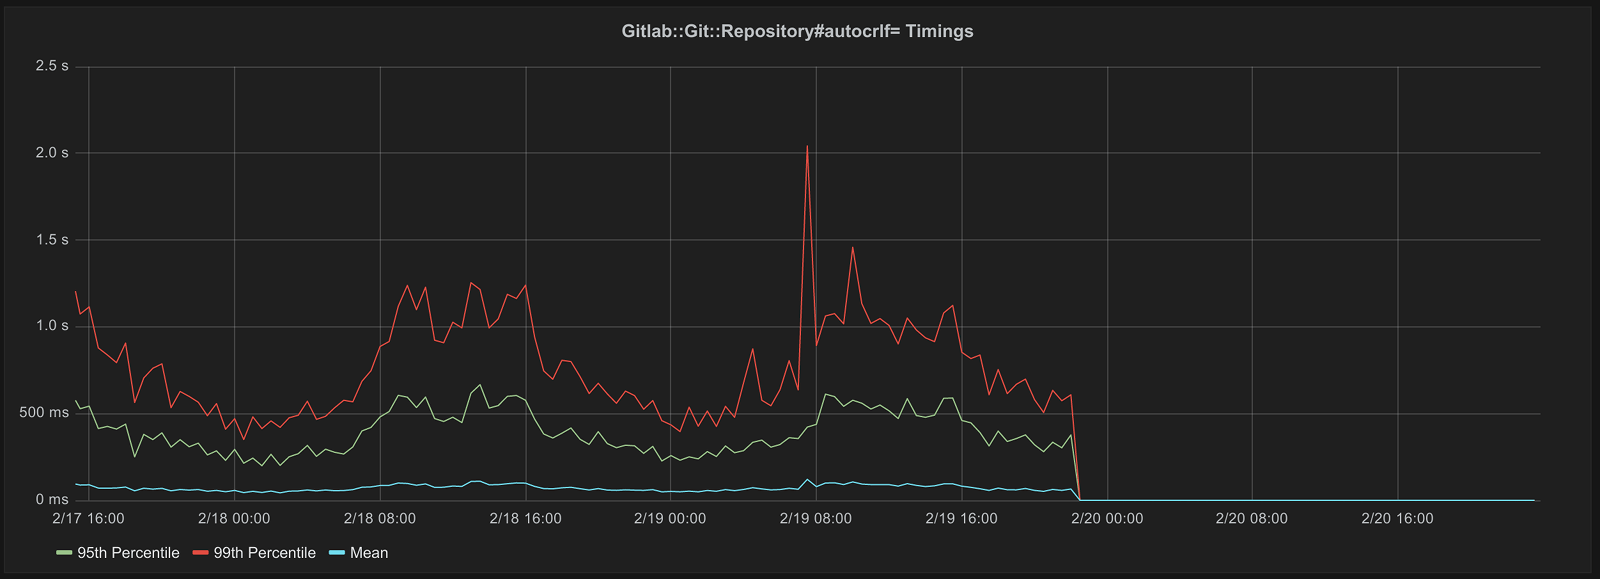
This particular method is used in quite a number of places and is used on almost every (if not every) project-specific page (issues, milestones, the project homepage, etc). Performance of this method was, well, bad:
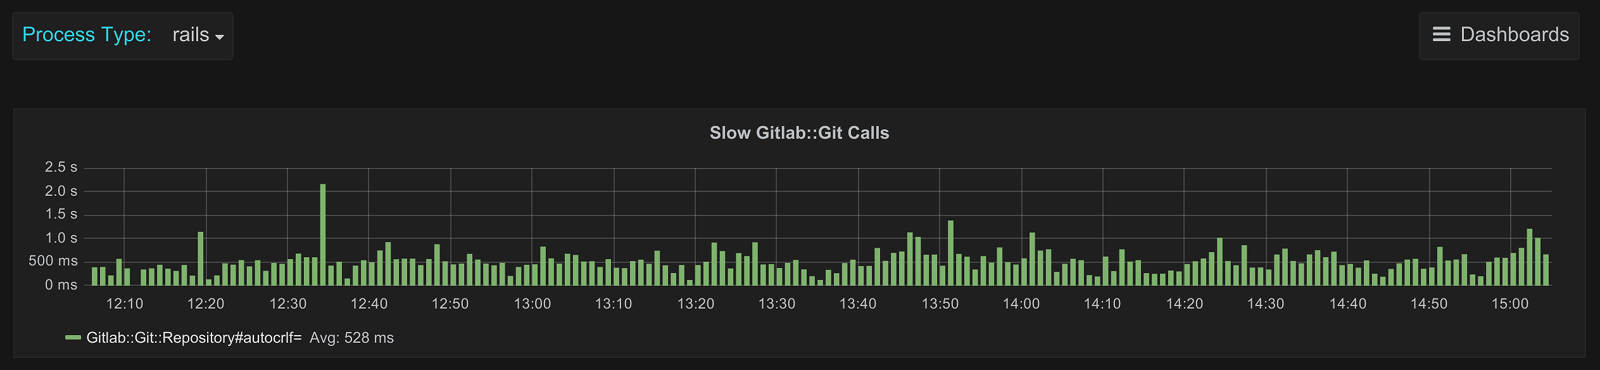
This particular graph plots the 95th percentile of the method
Gitlab::Git::Repository#autocrlf= which is used to set the core.autocrlf
option. We can see that on average the 95th percentile hovers around 500
milliseconds. That's 500 milliseconds on almost every page to set a Git option
that's already set 99% of the time. More importantly, that's 500 milliseconds of
time wasted on many pages where no changes are ever written to a Git repository,
thus never using this option.
It's clear that we don't want to run this on every page, especially when the option is not going to be used. However, we still have to make sure this option is set when we do need it. At this point my first thought was to see the overhead of always writing this option versus only writing this when actually needed. In Ruby code this would roughly translate to:
      repo = Gitlab::Git::Repository.new(path_to_repo)

# Only set autocrlf to :input if it's not already set to :input
repo.autocrlf = :input unless repo.autocrlf == :input
The idea was that when sharing a disk over the network (e.g. via an NFS server) a read is probably much faster than a write. A write may also end up locking files for the duration, possibly blocking other read operations. To test this I wrote a script that would perform said operation a number of times and write the timings to InfluxDB. This script is as the following:
      require 'rugged'
require 'thread'
require 'benchmark'
require 'influxdb'

Thread.abort_on_exception = true

path = '/var/opt/gitlab/git-data/repositories/yorickpeterse/cat-pictures.git'
key  = 'core.autocrlf'
read = true

influx_options = { udp: { host: 'HOST', port: PORT } }

threads = 10.times.map do
  Thread.new do
    client = InfluxDB::Client.new(influx_options)

    while read
      time = Benchmark.measure do
        repo = Rugged::Repository.new(path)

        repo.config[key] = 'input' unless repo.config[key] == 'input'
      end

      ms = time.real * 1000

      client.write_point('rugged_config_cas', values: { duration: ms })

      sleep 0.05
    end
  end
end

sleep(120)

read = false

threads.each(&:join)

Rugged::Repository.new(path).config[key] = 'input'
Here HOST and PORT were replaced with the hostname and port number of our InfluxDB server.
Running this script produced the following graph:
Next I modified this script to simply always write the autocrlf option, this produced the following graph:
Finally I modified the script to simply load the repository as-is, this produced the following graph:
In all 3 cases we can see there's not really a clear difference in timings, leading me to believe there's no particular benefit to only writing the option when not already set to "input".
I spent some more time trying out different things to see how they would impact performance but sadly didn't get much out of it. The details can be found in the various comments for issue 13457.
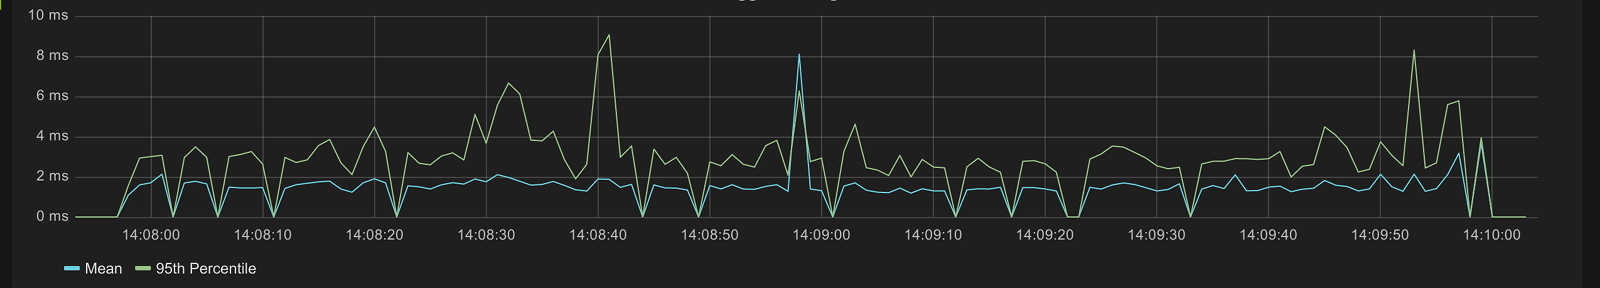
A day later I and Jacob Vosmaer decided to double check the idea of
writing only when needed by applying a small patch to GitLab.com. This patch
modified Repository#raw_repository to the autocrlf option would only be
written when needed just like the script above. We also made sure to measure the
timings of both reading and writing this option. After deploying this patch and
waiting for about half an hour to get enough data the timings were as the
following:
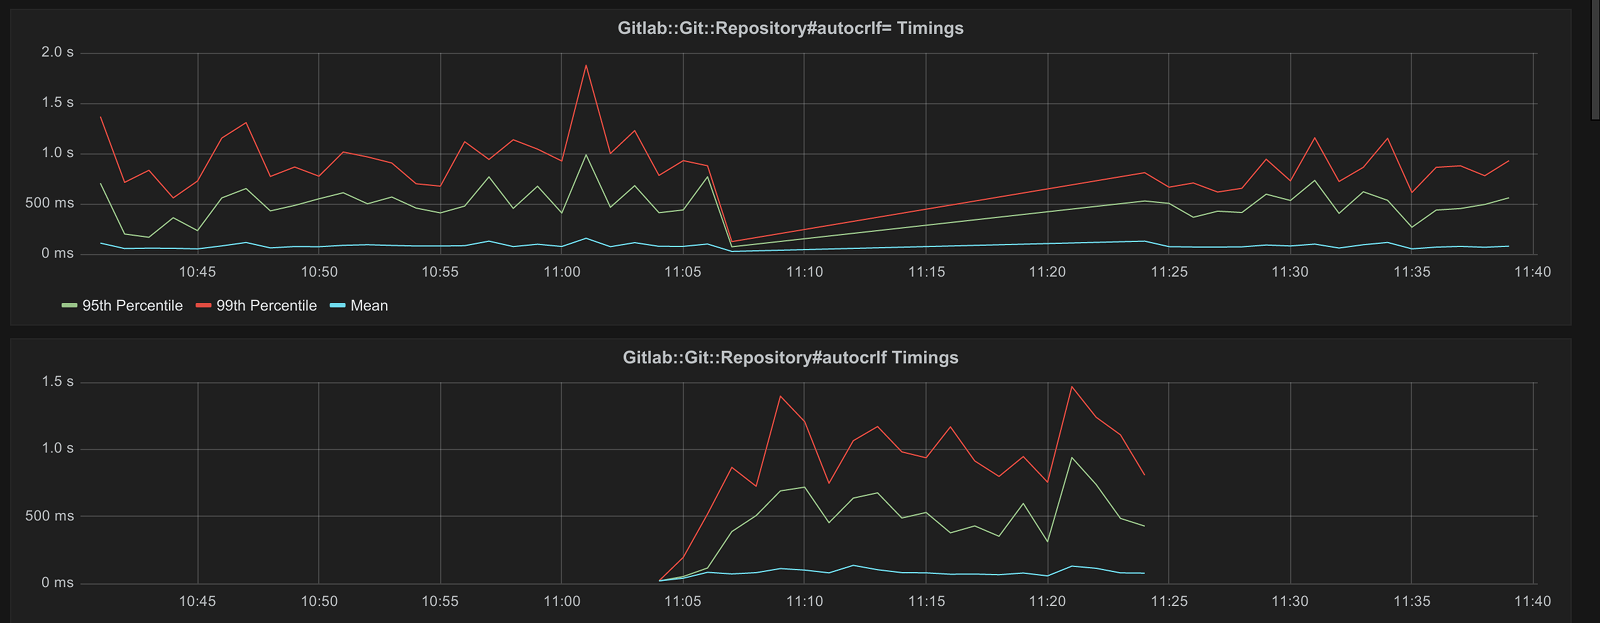
This graph shows a nice drop in timings for writing the autocrlf option, sadly at the cost of an increase in timings for reading the autocrlf option. In other words, this change didn't actually solve anything but instead just moved the problem from writing an option to just reading the option.
After discussing this with Jacob he suggested it may be an even better idea to
only set this option where we actually need it to, instead of checking (and
potentially writing) it on every page that happens to use
Repository#raw_repository. After all, the best way to speed code up is to
remove it entirely (or at least as much as possible).
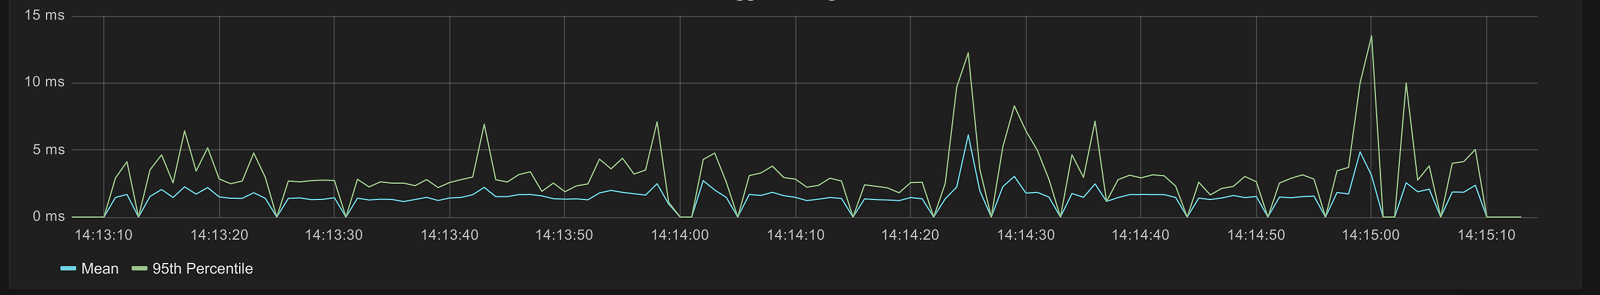
This lead to merge request "Only set autocrlf when creating/updating files" which does exactly that. The impact of this change can be seen in the following graph:
This graph shows the 95th percentile, 99th percentile, and the mean per 30 minutes. The drop around the 20th is after the above merge request was deployed to GitLab.com. The changes in this merge request resulted in the timings going from between 70 milliseconds and 2.1 seconds to less than 15 milliseconds.
Conclusion
In this article I only highlighted 3 merge requests that made it into 8.5.0. The following performance related merge requests are also included in 8.5.0:
- First pass at deleting projects in the background
- Background process note logic
- Page project list on dashboard
- Cache BroadcastMessage.current
- Smarter flushing of branch statistics caches
- Cache various Repository Git operations
- Dedicated method for counting commits between refs
These are just a few of the performance changes we've made over the past few months, and they certainly won't be the last as there's still a lot of work to be done.
More to explore
View all blog posts


We want to hear from you
Enjoyed reading this blog post or have questions or feedback? Share your thoughts by creating a new topic in the GitLab community forum.
Share your feedback