
is now in public beta!
Published on: November 28, 2022
27 min read
How we diagnosed and resolved Redis latency spikes with BPF and other tools
How we uncovered a three-phase cycle involving two distinct saturation points and a simple fix to break that cycle.


If you enjoy performance engineering and peeling back abstraction layers to ask underlying subsystems to explain themselves, this article’s for you. The context is a chronic Redis latency problem, and you are about to tour a practical example of using BPF and profiling tools in concert with standard metrics to reveal unintuitive behaviors of a complex system.
Beyond the tools and techniques, we also use an iterative hypothesis-testing approach to compose a behavior model of the system dynamics. This model tells us what factors influence the problem's severity and triggering conditions.
Ultimately, we find the root cause, and its remedy is delightfully boring and effective. We uncover a three-phase cycle involving two distinct saturation points and a simple fix to break that cycle. Along the way, we inspect aspects of the system’s behavior using stack sampling profiles, heat maps and flamegraphs, experimental tuning, source and binary analysis, instruction-level BPF instrumentation, and targeted latency injection under specific entry and exit conditions.
If you are short on time, the takeaways are summarized at the end. But the journey is the fun part, so let's dig in!
Introducing the problem: Chronic latency
GitLab makes extensive use of Redis, and, on GitLab.com SaaS, we use separate Redis clusters for certain functions. This tale concerns a Redis instance acting exclusively as a least recently used (LRU) cache.
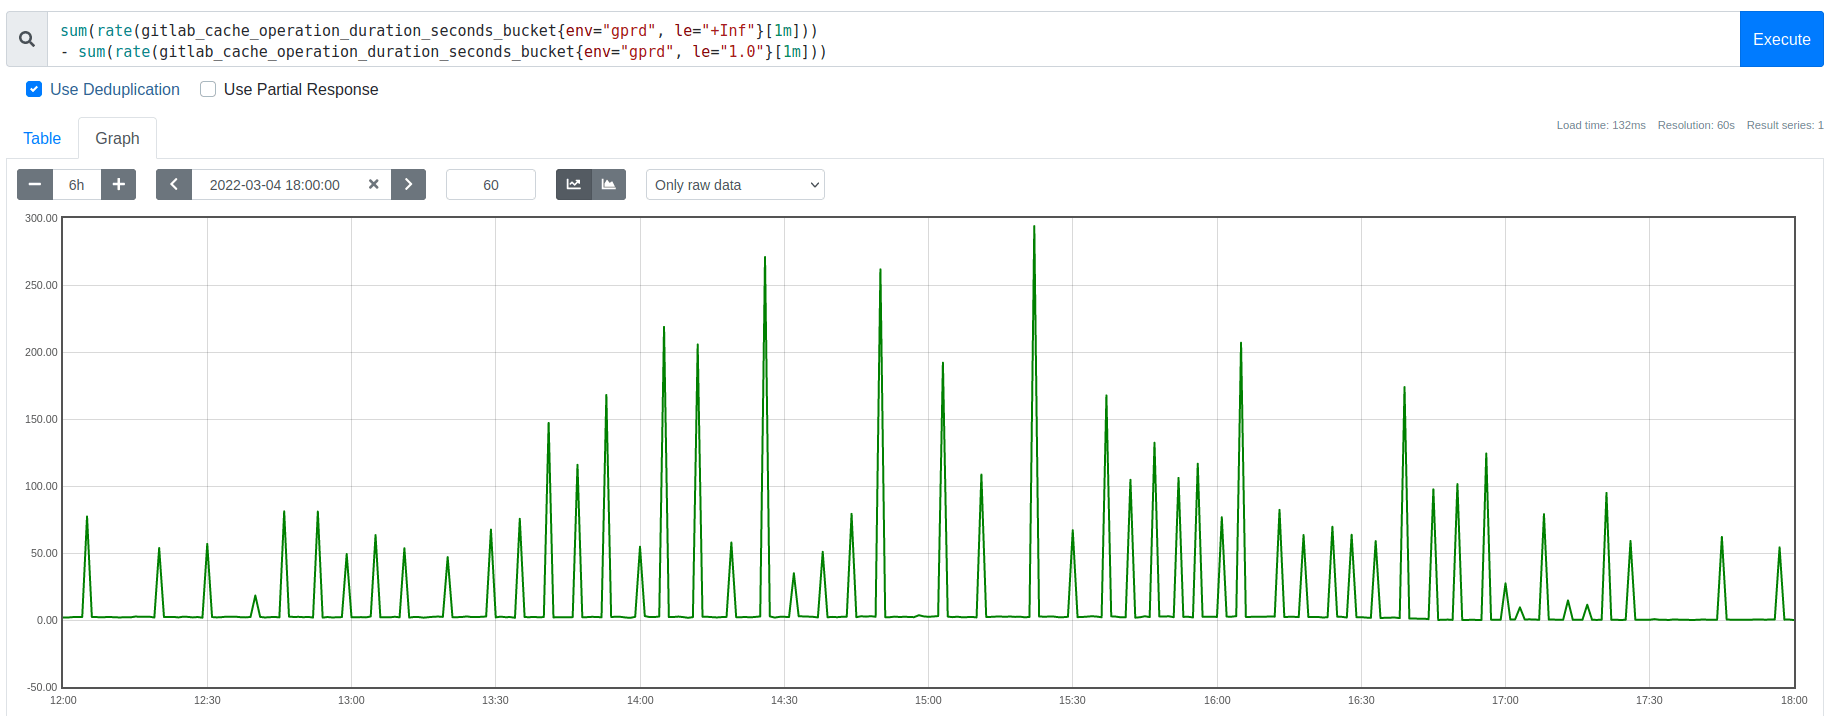
This cache had a chronic latency problem that started occurring intermittently over two years ago and in recent months had become significantly worse: Every few minutes, it suffered from bursts of very high latency and corresponding throughput drop, eating into its Service Level Objective (SLO). These latency spikes impacted user-facing response times and burned error budgets for dependent features, and this is what we aimed to solve.
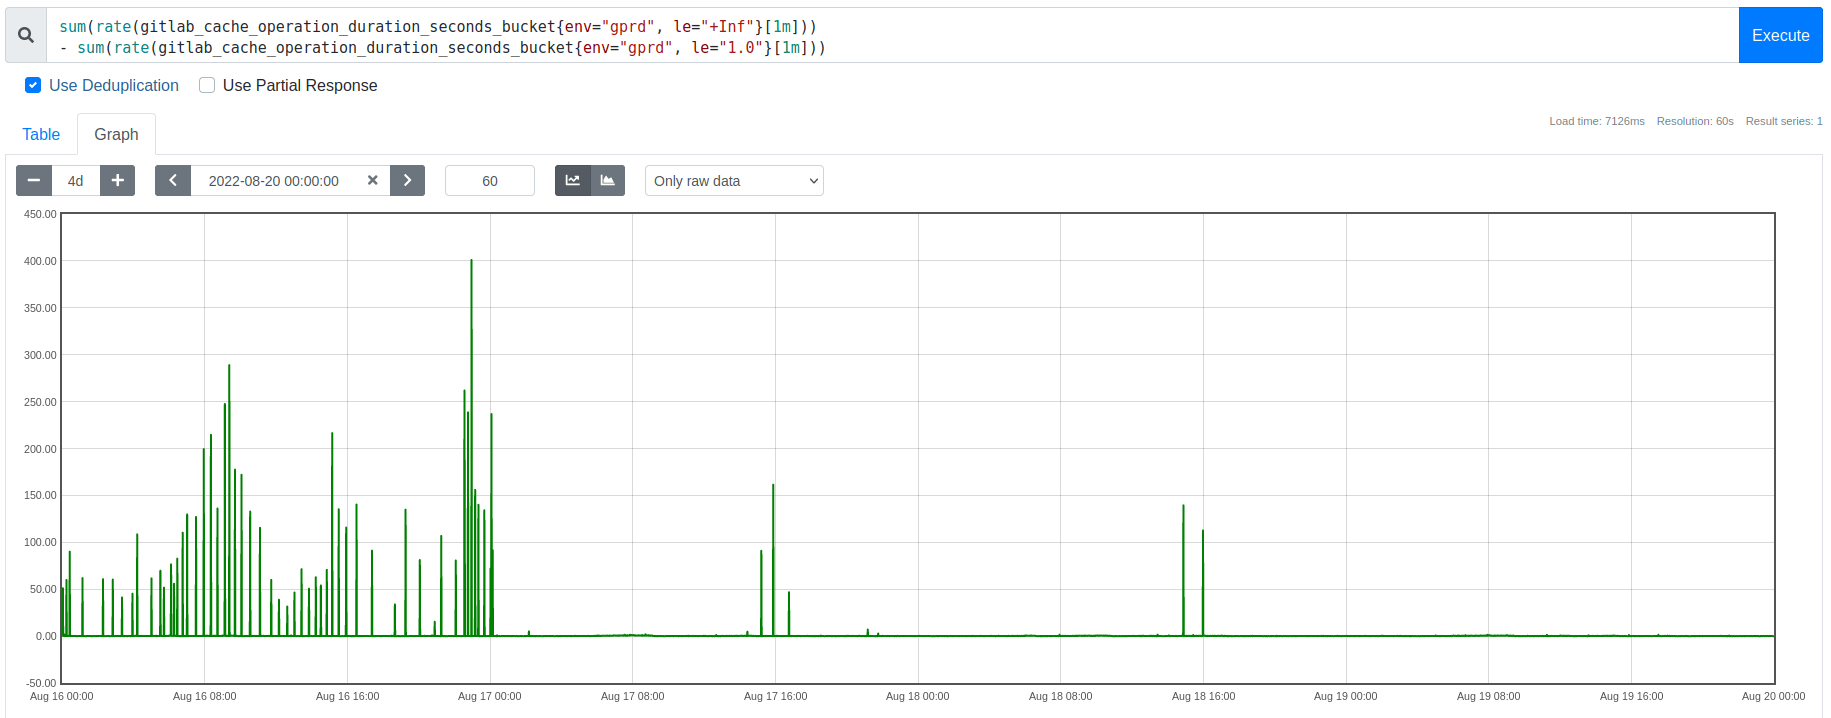
Graph: Spikes in the rate of extremely slow (1 second) Redis requests, each corresponding to an eviction burst
In prior work, we had already completed several mitigating optimizations. These sufficed for a while, but organic growth had resurfaced this as an important long-term scaling problem. We had also already ruled out externally triggered causes, such as request floods, connection rate spikes, host-level resource contention, etc. These latency spikes were consistently associated with memory usage reaching the eviction threshold (maxmemory), not by changes in client traffic patterns or other processes competing with Redis for CPU time, memory bandwidth, or network I/O.
We initially thought that Redis 6.2’s new eviction throttling mechanism might alleviate our eviction burst overhead. It did not. That mechanism solves a different problem: It prevents a stall condition where a single call to performEvictions could run arbitrarily long. In contrast, during this analysis we discovered that our problem (both before and after upgrading Redis) was related to numerous calls collectively reducing Redis throughput, rather than a few extremely slow calls causing a complete stall.
To discover our bottleneck and its potential solutions, we needed to investigate Redis’s behavior during our workload’s eviction bursts.
A little background on Redis evictions
At the time, our cache was oversubscribed, trying to hold more cache keys than the configured maxmemory threshold could hold, so evictions from the LRU cache were expected. But the dense concentration of that eviction overhead was surprising and troubling.
Redis is essentially single-threaded. With a few exceptions, the “main” thread does almost all tasks serially, including handling client requests and evictions, among other things. Spending more time on X means there is less remaining time to do Y, so think about queuing behavior as the story unfolds.
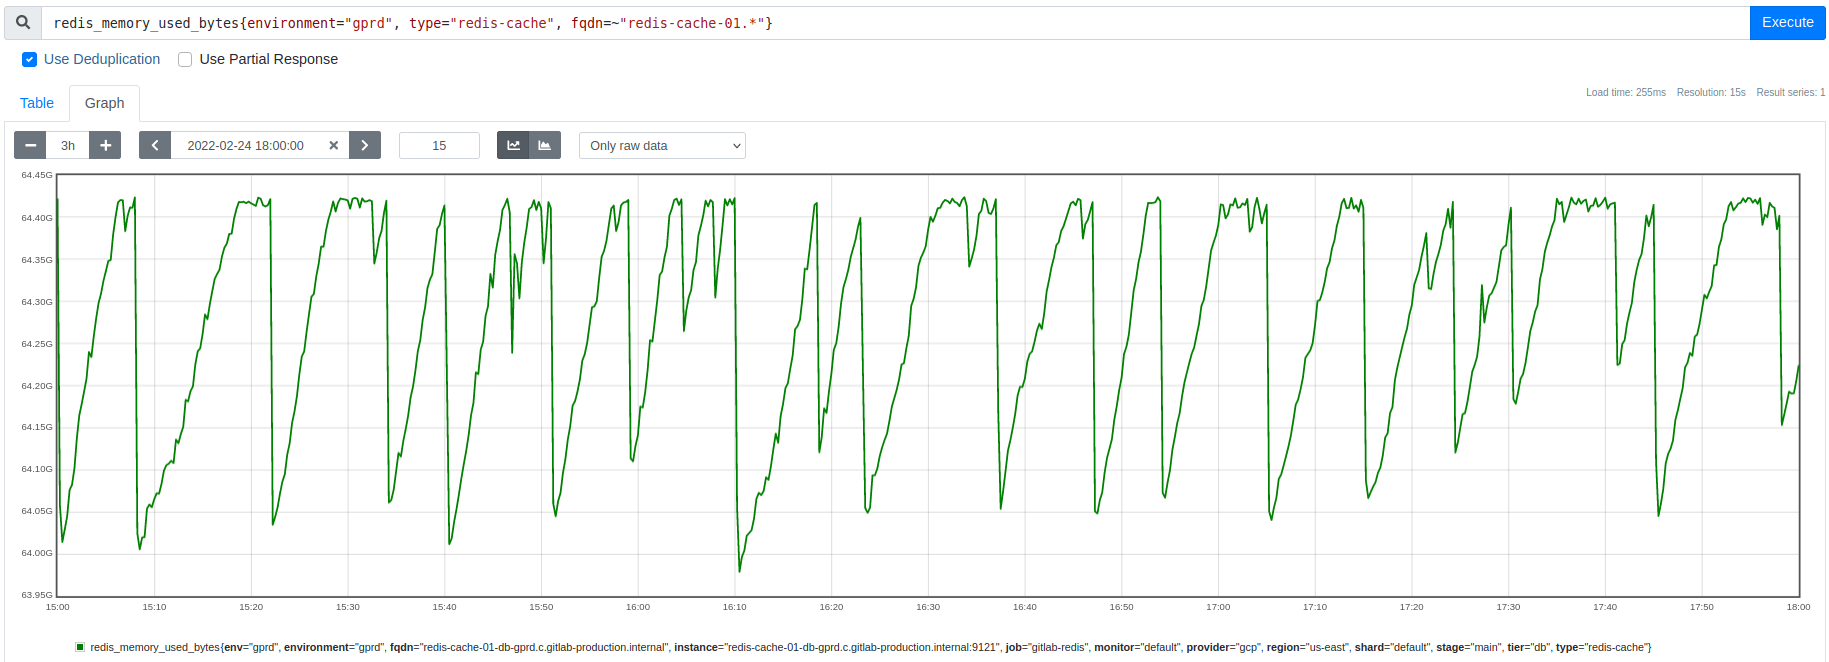
Whenever Redis reaches its maxmemory threshold, it frees memory by evicting some keys, aiming to do just enough evictions to get back under maxmemory. However, contrary to expectation, the metrics for memory usage and eviction rate (shown below) indicated that instead of a continuous steady eviction rate, there were abrupt burst events that freed much more memory than expected. After each eviction burst, no evictions occurred until memory usage climbed back up to the maxmemory threshold again.
Graph: Redis memory usage drops by 300-500 MB during each eviction burst:
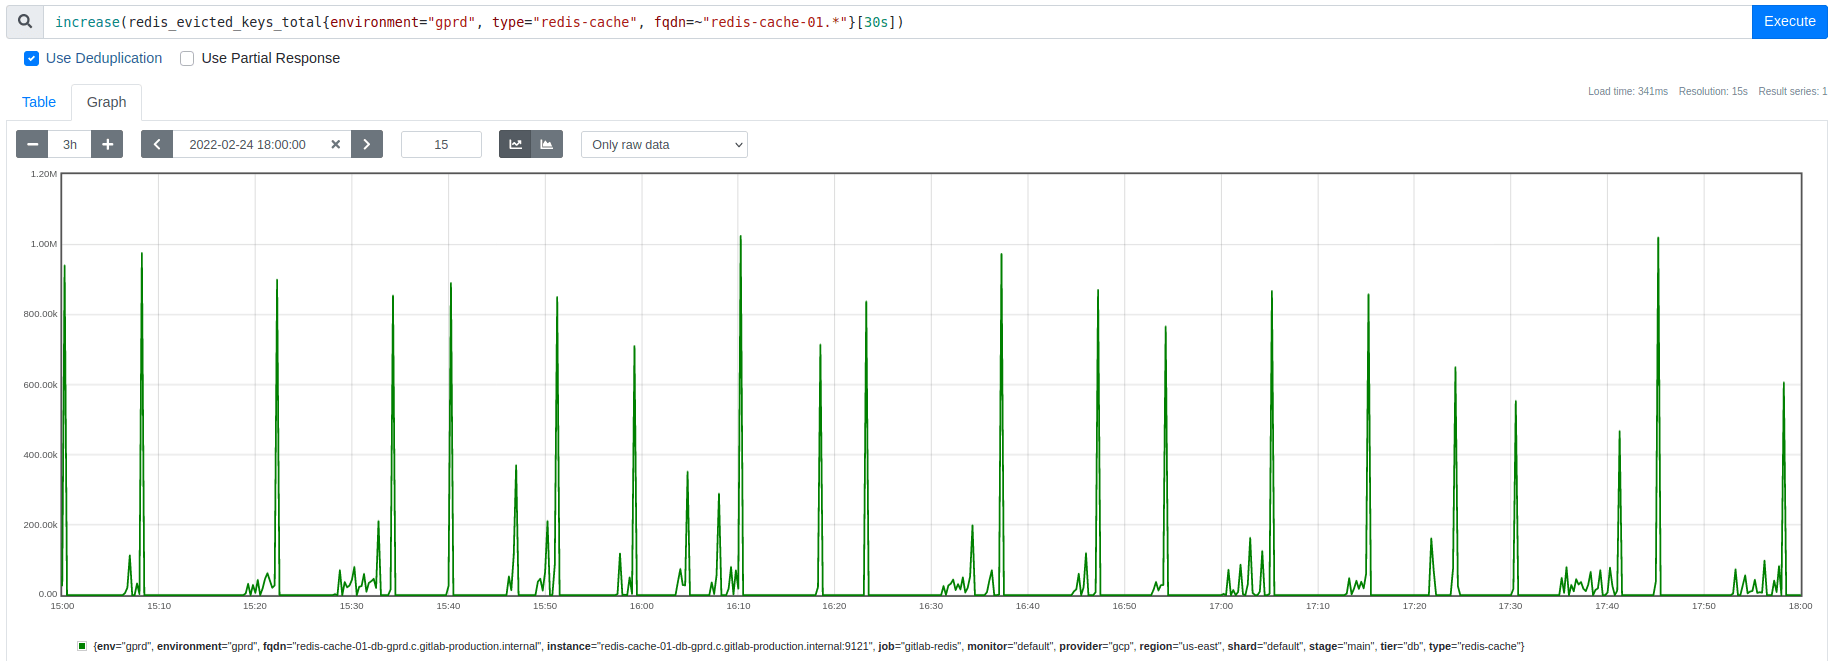
Graph: Key eviction spikes match the timing and size of the memory usage dips shown above
This apparent excess of evictions became the central mystery. Initially, we thought answering that question might reveal a way to smooth the eviction rate, spreading out the overhead and avoiding the latency spikes. Instead, we discovered that these bursts are an interaction effect that we need to avoid, but more on that later.
Eviction bursts cause CPU saturation
As shown above, we had found that these latency spikes correlated perfectly with large spikes in the cache’s eviction rate, but we did not yet understand why the evictions were concentrated into bursts that last a few seconds and occur every few minutes.
As a first step, we wanted to verify a causal relationship between eviction bursts and latency spikes.
To test this, we used perf to run a CPU sampling profile on the Redis main thread. Then we applied a filter to split that profile, isolating the samples where it was calling the performEvictions function. Using flamescope, we can visualize the profile’s CPU usage as a subsecond offset heat map, where each second on the X axis is folded into a column of 20 msec buckets along the Y axis. This visualization style highlights sub-second activity patterns. Comparing these two heat maps confirmed that during an eviction burst, performEvictions is starving all other main thread code paths for CPU time.
Graph: Redis main thread CPU time, excluding calls to performEvictions
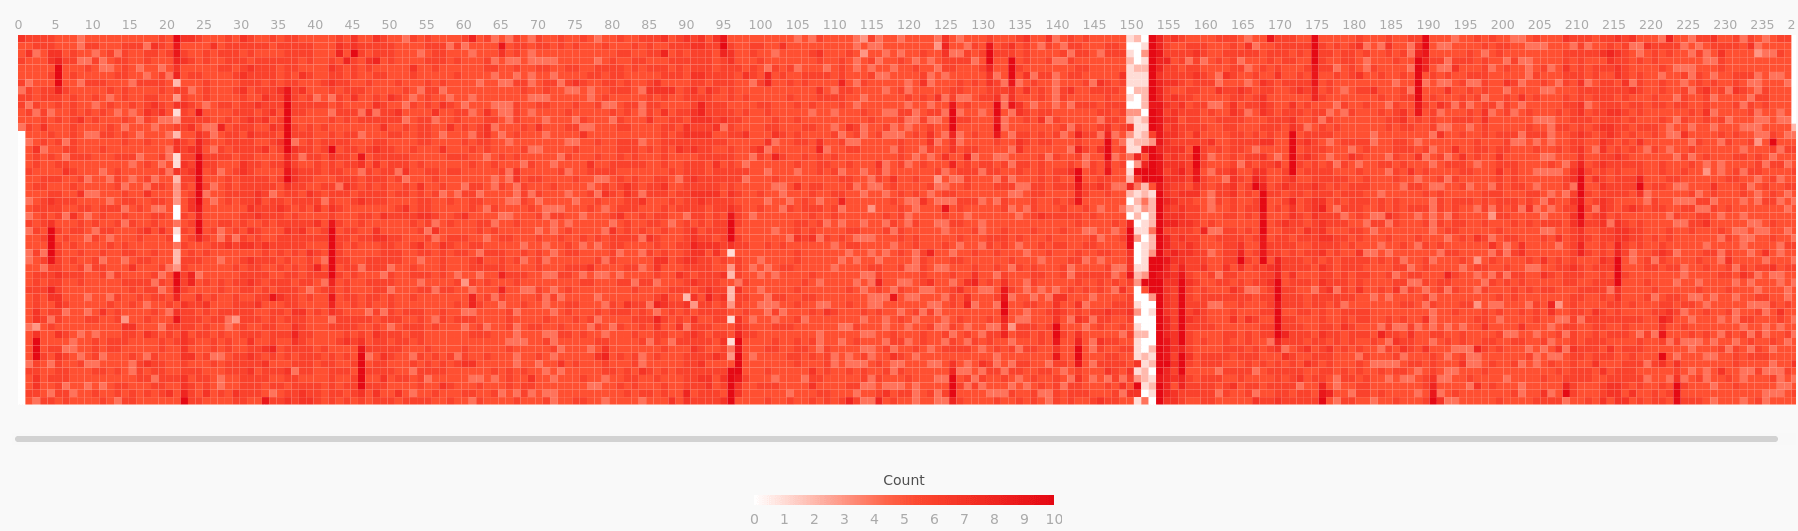
Graph: Remainder of the same profile, showing only the calls to performEvictions
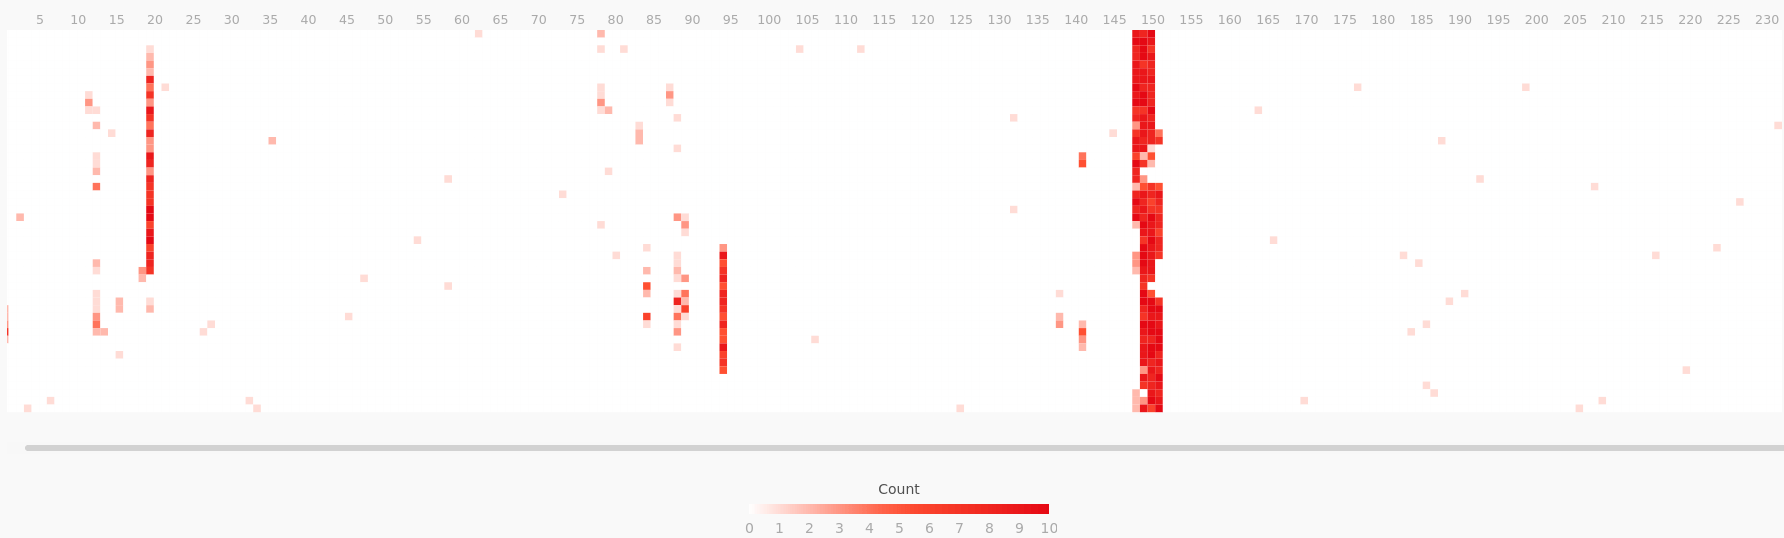
These results confirm that eviction bursts are causing CPU starvation on the main thread, which acts as a throughput bottleneck and increases Redis’s response time latency. These CPU utilization bursts typically lasted a few seconds, so they were too short-lived to trigger alerts but were still user impacting.
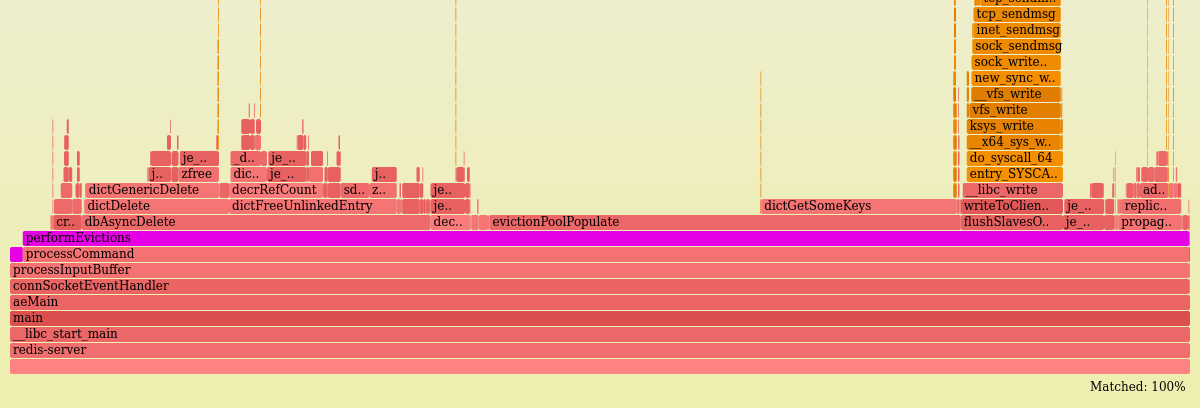
For context, the following flamegraph shows where performEvictions spends its CPU time. There are a few interesting things here, but the most important takeaways are:
- It gets called synchronously by
processCommand(which handles all client requests). - It handles many of its own deletes. Despite its name, the
dbAsyncDeletefunction only delegates deletes to a helper thread under certain conditions which turn out to be rare for this workload.
For more details on this analysis, see the walkthrough and methodology.
How fast are individual calls to performEvictions?
Each incoming request to Redis is handled by a call to processCommand, and it always concludes by calling the performEvictions function. That call to performEvictions is frequently a no-op, returning immediately after checking that the maxmemory threshold has not been breached. But when the threshold is exceeded, it will continue evicting keys until it either reaches its mem_tofree goal or exceeds its configured time limit per call.
The CPU heat maps shown earlier proved that performEvictions calls were collectively consuming a large majority of CPU time for up to several seconds.
To complement that, we also measured the wall clock time of individual calls.
Using the funclatency CLI tool (part of the BCC suite of BPF tools), we measured call duration by instrumenting entry and exit from the performEvictions function and aggregated those measurements into a histogram at 1-second intervals. When no evictions were occurring, the calls were consistently low latency (4-7 usecs/call). This is the no-op case described above (including 2.5 usecs/call of instrumentation overhead). But during an eviction burst, the results shift to a bimodal distribution, including a combination of the fast no-op calls along with much slower calls that are actively performing evictions:
$ sudo funclatency-bpfcc --microseconds --timestamp --interval 1 --duration 600 --pid $( pgrep -o redis-server ) '/opt/gitlab/embedded/bin/redis-server:performEvictions'
...
23:54:03
     usecs               : count     distribution
         0 -> 1          : 0        |                                        |
         2 -> 3          : 576      |************                            |
         4 -> 7          : 1896     |****************************************|
         8 -> 15         : 392      |********                                |
        16 -> 31         : 84       |*                                       |
        32 -> 63         : 62       |*                                       |
        64 -> 127        : 94       |*                                       |
       128 -> 255        : 182      |***                                     |
       256 -> 511        : 826      |*****************                       |
       512 -> 1023       : 750      |***************                         |
This measurement also directly confirmed and quantified the throughput drop in Redis requests handled per second: The call rate to performEvictions (and hence to processCommand) dropped to 20% of its norm from before the evictions began, from 25K to 5K calls per second.
This has a huge impact on clients: New requests are arriving at 5x the rate they are being completed. And crucially, we will see soon that this asymmetry is what drives the eviction burst.
For more details on this analysis, see the safety check for instrumentation overhead and the results walkthrough. And for more general reference, the BPF instrumentation overhead estimate is based on these benchmark results.
Experiment: Can tuning mitigate eviction-driven CPU saturation?
The analyses so far had shown that evictions were severely starving the Redis main thread for CPU time. There were still important unanswered questions (which we will return to shortly), but this was already enough info to suggest some experiments to test potential mitigations:
- Can we spread out the eviction overhead so it takes longer to reach its goal but consumes a smaller percentage of the main thread’s time?
- Are evictions freeing more memory than expected due to scheduling a lot of keys to be asynchronously deleted by the lazyfree mechanism? Lazyfree is an optional feature that lets the Redis main thread delegate to an async helper thread the expensive task of deleting keys that have more than 64 elements. These async evictions do not count immediately towards the eviction loop’s memory goal, so if many keys qualify for lazyfree, this could potentially drive many extra iterations of the eviction loop.
The answers to both turned out to be no:
- Reducing
maxmemory-eviction-tenacityto its minimum setting still did not makeperformEvictionscheap enough to avoid accumulating a request backlog. It did increase response rate, but arrival rate still far exceeded it, so this was not an effective mitigation. - Disabling
lazyfree-lazy-evictiondid not prevent the eviction burst from dropping memory usage far belowmaxmemory. Those lazyfrees represent a small percentage of reclaimed memory. This rules out one of the potential explanations for the mystery of excessive memory being freed.
Having ruled out two potential mitigations and one candidate hypothesis, at this point we return to the pivotal question: Why are several hundred extra megabytes of memory being freed by the end of each eviction burst?
Why do evictions occur in bursts and free too much memory?
Each round of eviction aims to free just barely enough memory to get back under the maxmemory threshold.
With a steady rate of demand for new memory allocations, the eviction rate should be similarly steady. The rate of arriving cache writes does appear to be steady. So why are evictions happening in dense bursts, rather than smoothly? And why do they reduce memory usage on a scale of hundreds of megabytes rather than hundreds of bytes?
Some potential explanations to explore:
- Do evictions only end when a large key gets evicted, spontaneously freeing enough memory to skip evictions for a while? No, the memory usage drop is far bigger than the largest keys in the dataset.
- Do deferred lazyfree evictions cause the eviction loop to overshoot its goal, freeing more memory than intended? No, the above experiment disproved this hypothesis.
- Is something causing the eviction loop to sometimes calculate an unexpectedly large value for its
mem_tofreegoal? We explore this next. The answer is no, but checking it led to a new insight. - Is a feedback loop causing evictions to become somehow self-amplifying? If so, what conditions lead to entering and leaving this state? This turned out to be correct.
These were all plausible and testable hypotheses, and each would point towards a different solution to the eviction-driven latency problem.
The first two hypotheses we have already eliminated.
To test the next two, we built custom BPF instrumentation to peek at the calculation of mem_tofree at the start of each call to performEvictions.
Observing the mem_tofree calculation with bpftrace
This part of the investigation was a personal favorite and led to a critical realization about the nature of the problem.
As noted above, our two remaining hypotheses were:
- an unexpectedly large
mem_tofreegoal - a self-amplifying feedback loop
To differentiate between them, we used bpftrace to instrument the calculation of mem_tofree, looking at its input variables and results.
This set of measurements directly tests the following:
- Does each call to
performEvictionsaim to free a small amount of memory -- perhaps roughly the size of an average cache entry? Ifmem_tofreeever approaches hundreds of megabytes, that would confirm the first hypothesis and reveal what part of the calculation was causing that large value. Otherwise, it rules out the first hypothesis and makes the feedback loop hypothesis more likely. - Does the replication buffer size significantly influence
mem_tofreeas a feedback mechanism? Each eviction adds to this buffer, just like normal writes do. If this buffer grows large (possibly partly due to evictions) and then abruptly shrinks (due to the peer consuming it), that would cause a spontaneous large drop in memory usage, ending evictions and instantly reducing memory usage. This is one potential way for evictions to drive a feedback loop.
To peek at the values of the mem_tofree calculation (script), we needed to isolate the correct call from performEvictions to the getMaxmemoryState function and reverse engineer its assembly to find the right instruction and register to instrument for each of the source code level variables that we wanted to capture. From that data we generate histograms for each of the following variables:
mem_reported = zmalloc_used_memory()        // All used memory tracked by jemalloc
overhead = freeMemoryGetNotCountedMemory()  // Replication output buffers + AOF buffer
mem_used = mem_reported - overhead          // Non-exempt used memory
mem_tofree = mem_used - maxmemory           // Eviction goal
Caveat: Our custom BPF instrumentation is specific to this particular build of the redis-server binary, since it attaches to virtual addresses that are likely to change the next time Redis is compiled. But the approach is able to be generalized. Treat this as a concrete example of using BPF to inspect source code variables in the middle of a function call without having to rebuild the binary. Because we are peeking at the function’s intermediate state and because the compiler inlined this function call, we needed to do binary analysis to find the correct instrumentation points. In general, peeking at a function’s arguments or return value is easier and more portable, but in this case it would not suffice.
The results:
- Ruled out the first hypothesis: Each call to
performEvictionshad a small target value (mem_tofree< 2 MB). This means each call toperformEvictionsdid a small amount of work. Redis’s mysterious rapid drop in memory usage cannot have been caused by an abnormally largemem_tofreetarget evicting a big batch of keys all at once. Instead, there must be many calls collectively driving down memory usage. - The replication output buffers remained consistently small, ruling out one of the potential feedback loop mechanisms.
- Surprisingly,
mem_tofreewas usually 16 KB to 64 KB, which is larger than a typical cache entry. This size discrepancy hints that cache keys may not be the main source of the memory pressure perpetuating the eviction burst once it begins.
All of the above results were consistent with the feedback loop hypothesis.
In addition to answering the initial questions, we got a bonus outcome: Concurrently measuring both mem_tofree and mem_used revealed a crucial new fact – the memory reclaim is a completely distinct phase from the eviction burst.
Reframing the pathology as exhibiting separate phases for evictions versus memory reclaim led to a series of realizations, described in the next section. From that emerged a coherent hypothesis explaining all the observed properties of the pathology.
For more details on this analysis, see methodology notes, build notes supporting the disassembly of the Redis binary, and initial interpretations.
Three-phase cycle
With the above results indicating a distinct separation between the evictions and the memory reclaim, we can now concisely characterize three phases in the cycle of eviction-driven latency spikes.
Graph: Diagram (not to scale) comparing memory and CPU usage to request and response rates during each of the three phases

Phase 1: Not saturated (7-15 minutes)
- Memory usage is below
maxmemory. No evictions occur during this phase. - Memory usage grows organically until reaching
maxmemory, which starts the next phase.
Phase 2: Saturated memory and CPU (6-8 seconds)
- When memory usage reaches
maxmemory, evictions begin. - Evictions occur only during this phase, and they occur intermittently and frequently.
- Demand for memory frequently exceeds free capacity, repeatedly pushing memory usage above
maxmemory. Throughout this phase, memory usage oscillates close to themaxmemorythreshold, evicting a small amount of memory at a time, just enough to get back undermaxmemory.
Phase 3: Rapid memory reclaim (30-60 seconds)
- No evictions occur during this phase.
- During this phase, something that had been holding a lot of memory starts quickly and steadily releasing it.
- Without the overhead of running evictions, CPU time is again spent mostly on handling requests (starting with the backlog that accumulated during Phase 2).
- Memory usage drops rapidly and steadily. By the time this phase ends, hundreds of megabytes have been freed. Afterwards, the cycle restarts with Phase 1.
At the transition between Phase 2 and Phase 3, evictions abruptly ended because memory usage stays below the maxmemory threshold.
Reaching that transition point where memory pressure becomes negative signals that whatever was driving the memory demand in Phase 2 has started releasing memory faster than it is consuming it, shrinking the footprint it had accumulated during the previous phase.
What is this mystery memory consumer that bloats its demand during Phase 2 and frees it during Phase 3?
The mystery revealed
Modeling the phase transitions gave us some useful constraints that a viable hypothesis must satisfy. The mystery memory consumer must:
- quickly bloat its footprint to hundreds of megabytes on a timescale of less than 10 seconds (the duration of Phase 2), under conditions triggered by the start of an eviction burst
- quickly release its accumulated excess on a timescale of just tens of seconds (the duration of Phase 3), under the conditions immediately following an eviction burst
The answer: The client input/output buffers meet those constraints to be the mystery memory consumer.
Here is how that hypothesis plays out:
- During Phase 1 (healthy state), the Redis main thread’s CPU usage is already fairly high. At the start of Phase 2, when evictions begin, the eviction overhead saturates the main thread’s CPU capacity, quickly dropping response rate below the incoming request rate.
- This throughput mismatch between arrivals versus responses is itself the amplifier that takes over driving the eviction burst. As the size of that rate gap increases, the proportion of time spent doing evictions also increases.
- Accumulating a backlog of requests requires memory, and that backlog continues to grow until enough clients are stalled that the arrival rate drops to match the response rate. As clients stall, the arrival rate falls, and with it the memory pressure, eviction rate, and CPU overhead begin to reduce.
- At the equilibrium point when arrival rate falls to match response rate, memory demand is satisfied and evictions stop (ending Phase 2). Without the eviction overhead, more CPU time is available to process the backlog, so response rate increases above request arrival rate. This recovery phase steadily consumes the request backlog, incrementally freeing memory as it goes (Phase 3).
- Once the backlog is resolved, the arrival and response rates match again. CPU usage is back to its Phase 1 norm, and memory usage has temporarily dropped in proportion to the max size of Phase 2’s request backlog.
We confirmed this hypothesis via a latency injection experiment showing that queuing alone explains the pathology. This outcome supports the conclusion that the extra memory demand originates from response rate falling below request arrival rate.
Remedies: How to avoid entering the eviction burst cycle
Now that we understand the dynamics of the pathology, we can draw confident conclusions about viable solutions.
Redis evictions are only self-amplifying when all of the following conditions are present:
- Memory saturation: Memory usage reaches the
maxmemorylimit, causing evictions to start. - CPU saturation: The baseline CPU usage by the Redis main thread’s normal workload is close enough to a whole core that the eviction overhead pushes it to saturation. This reduces the response rate below request arrival rate, inducing self-amplification via increased memory demand for request buffering.
- Many active clients: The saturation only lasts as long as request arrival rate exceeds response rate. Stalled clients no longer contribute to that arrival rate, so the saturation lasts longer and has a greater impact if Redis has many active clients still sending requests.
Viable remedies include:
- Avoid memory saturation by any combination of the following to make peak memory usage less than the
maxmemorylimit:- Reduce cache time to live (TTL)
- Increase
maxmemory(and host memory if needed, but watch out fornuma_balancingCPU overhead on hosts with multiple NUMA nodes) - Adjust client behavior to avoid writing unnecessary cache entries
- Split the cache among multiple instances (sharding or functional partitioning, helps avoid both memory and CPU saturation)
- Avoid CPU saturation by any combination of the following to make peak CPU usage for the workload plus eviction overhead be less than 1 CPU core:
- Use the fastest processor available for single-threaded instructions per second
- Isolate the redis-server process (particularly its main thread) from any other competing CPU-intensive processes (dedicated host, taskset, cpuset)
- Adjust client behavior to avoid unnecessary cache lookups or writes
- Split the cache among multiple instances (sharding or functional partitioning, helps avoid both memory and CPU saturation)
- Offload work from the Redis main thread (io-threads, lazyfree)
- Reduce eviction tenacity (only gives a minor benefit in our experiments)
More exotic potential remedies could include a new Redis feature. One idea is to exempt ephemeral allocations like client buffers from counting towards the maxmemory limit, instead applying that limit only to key storage. Alternatively, we could limit evictions to only consume at most a configurable percentage of the main thread’s time, so that most of its time is still spent on request throughput rather than eviction overhead.
Unfortunately, either of those features would trade one failure mode for another, reducing the risk of eviction-driven CPU saturation while increasing the risk of unbounded memory growth at the process level, which could potentially saturate the host or cgroup and lead to an OOM, or out of memory, kill. That trade-off may not be worthwhile, and in any case it is not currently an option.
Our solution
We had already exhausted the low-hanging fruit for CPU efficiency, so we focused our attention on avoiding memory saturation.
To improve the cache’s memory efficiency, we evaluated which types of cache keys were using the most space and how much IDLETIME they had accrued since last access. This memory usage profile identified some rarely used cache entries (which waste space), helped inform the TTL, or time to live, tuning by first focusing on keys with a high idle time, and highlighted some useful potential cutpoints for functionally partitioning the cache.
We decided to concurrently pursue several cache efficiency improvements and opened an epic for it. The goal was to avoid chronic memory saturation, and the main action items were:
- Iteratively reduce the cache’s default TTL from 2 weeks to 8 hours (helped a lot!)
- Switch to client-side caching for certain cache keys (efficiently avoids spending shared cache space on non-shared cache entries)
- Partition a set of cache keys to a separate Redis instance
The TTL reduction was the simplest solution and turned out to be a big win. One of our main concerns with TTL reduction was that the additional cache misses could potentially increase workload on other parts of the infrastructure. Some cache misses are more expensive than others, and our metrics are not granular enough to quantify the cost of cache misses per type of cache entry. This concern is why we applied the TTL adjustment incrementally and monitored for SLO violations. Fortunately, our inference was correct: Reducing TTL did not significantly reduce the cache hit rate, and the additional cache misses did not cause noticeable impact to downstream subsystems.
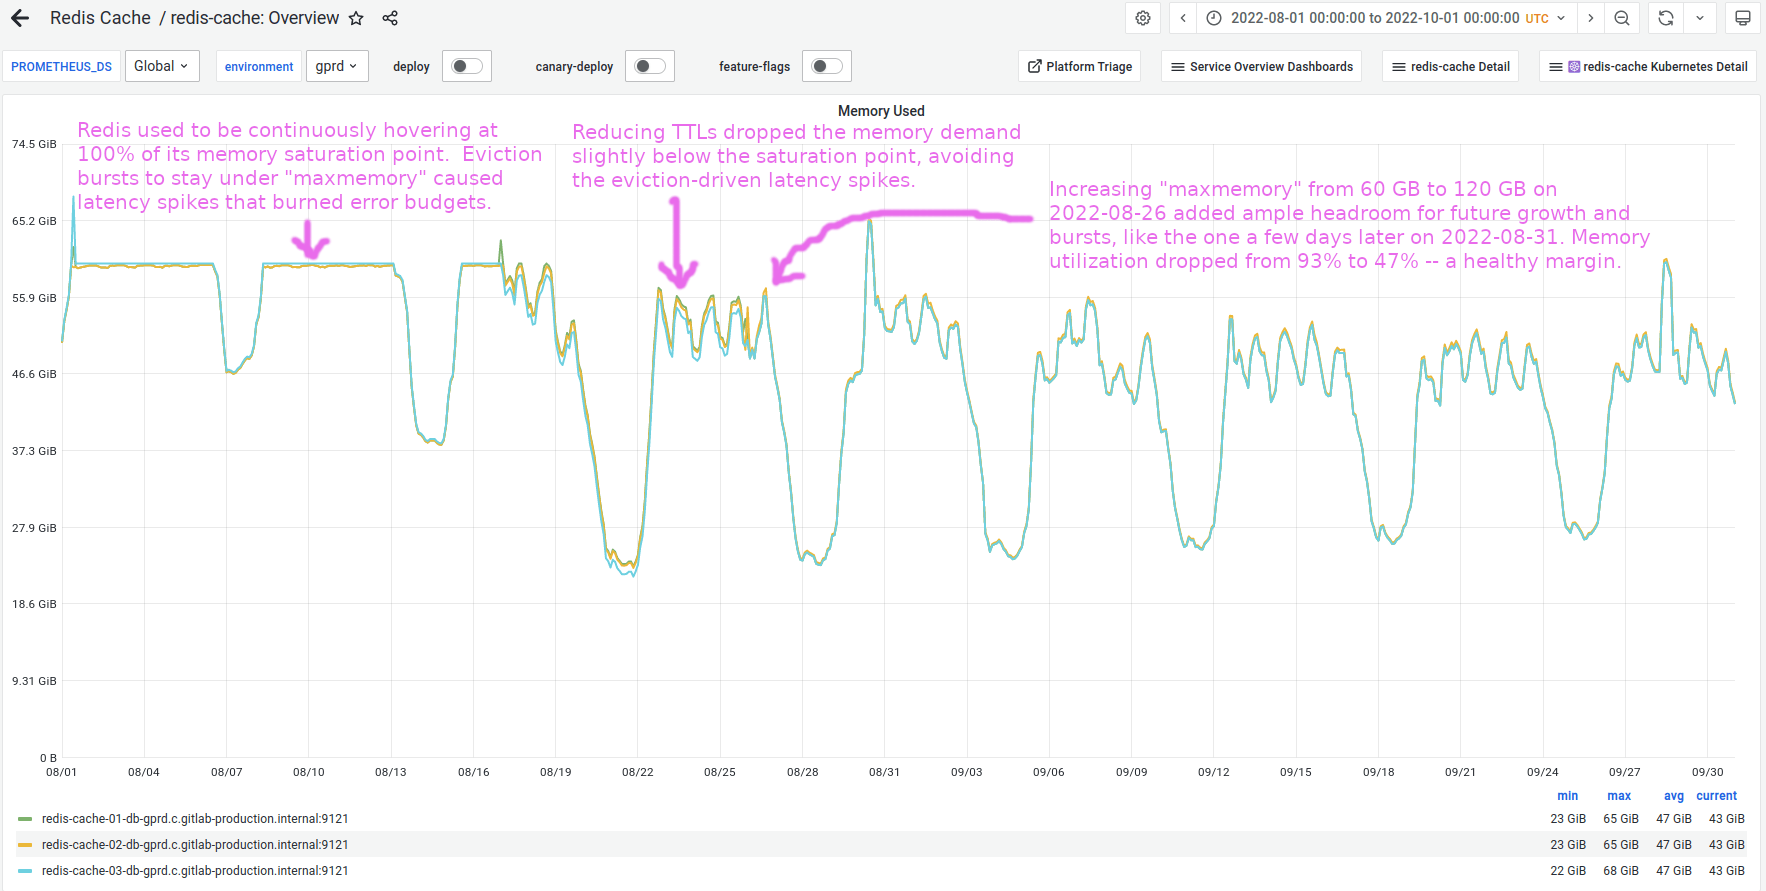
The TTL reduction turned out to be sufficient to drop memory usage consistently a little below its saturation point.
Increasing maxmemory had initially not been feasible because the original peak memory demand (prior to the efficiency improvements) was expected to be larger than the max size of the VMs we use for Redis. However, once we dropped memory demand below saturation, then we could confidently provision headroom for future growth and re-enable saturation alerting.
Results
The following graph shows Redis memory usage transitioning out of its chronically saturated state, with annotations describing the milestones when latency spikes ended and when saturation margin became wide enough to be considered safe:
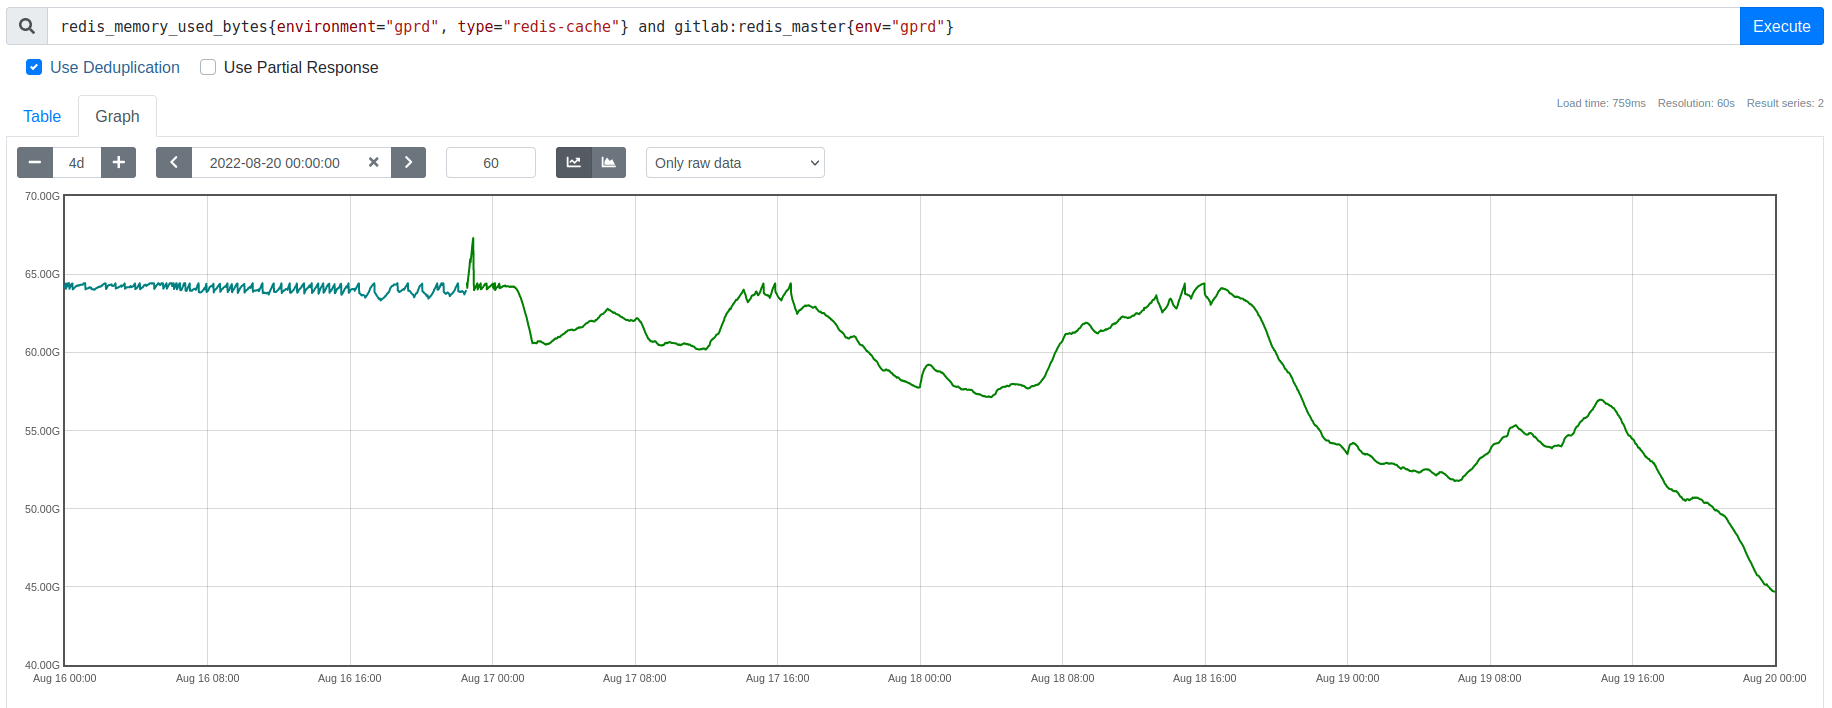
Zooming into the days when we rolled out the TTL adjustments, we can see the harmful eviction-driven latency spikes vanish as we drop memory usage below its saturation point, exactly as predicted:
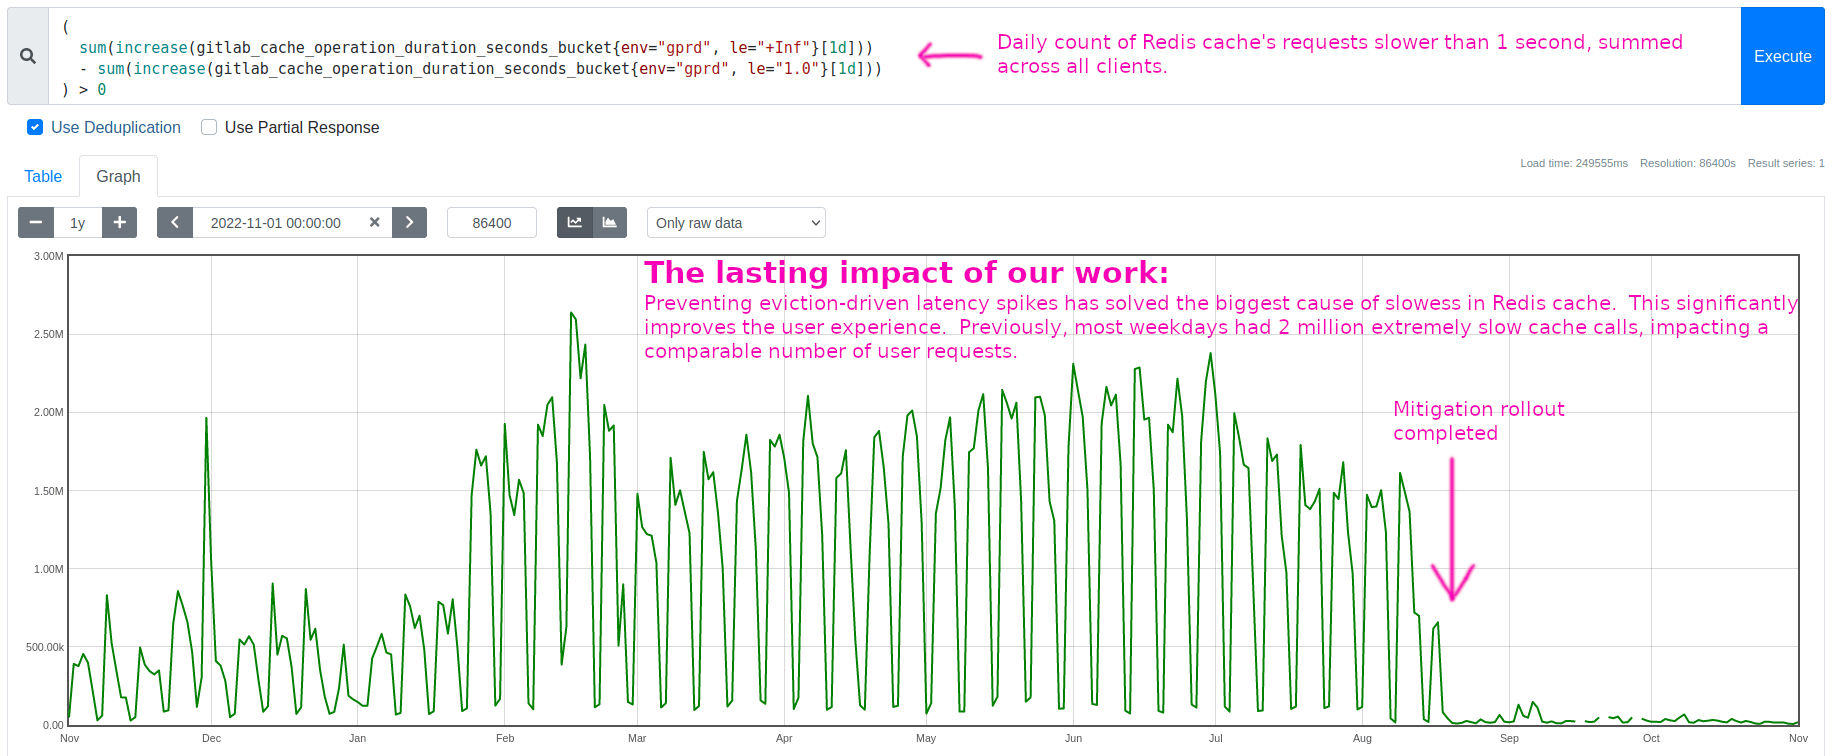
These eviction-driven latency spikes had been the biggest cause of slowess in Redis cache.
Solving this source of slowness significantly improved the user experience. This 1-year lookback shows only the long-tail portion of the improvement, not even the full benefit. Each weekday had roughly 2 million Redis requests slower than 1 second, until our fix in mid-August:
Conclusions
We solved a long-standing latency problem that had been worsening as the workload grew, and we learned a lot along the way. This article focuses mostly on the Redis discoveries, since those are general behaviors that some of you may encounter in your travels. We also developed some novel tools and analytical methods and uncovered several useful environment-specific facts about our workload, infrastructure, and observability, leading to several additional improvements and proposals not mentioned above.
Overall, we made several efficiency improvements and broke the cycle that was driving the pathology. Memory demand now stays well below the saturation point, eliminating the latency spikes that were burning error budgets for the development teams and causing intermittent slowness for users. All stakeholders are happy, and we came away with deeper domain knowledge and sharper skills!
Key insights summary
The following notes summarize what we learned about Redis eviction behavior (current as of version 6.2):
- The same memory budget (
maxmemory) is shared by key storage and client connection buffers. A spike in demand for client connection buffers counts towards themaxmemorylimit, in the same way that a spike in key inserts or key size would. - Redis performs evictions in the foreground on its main thread. All time spent in
performEvictionsis time not spent handling client requests. Consequently, during an eviction burst, Redis has a lower throughput ceiling. - If eviction overhead saturates the main thread’s CPU, then response rate falls below request arrival rate. Redis accumulates a request backlog (which consumes memory), and clients experience this as slowness.
- The memory used for pending requests requires more evictions, driving the eviction burst until enough clients are stalled that arrival rate falls back below response rate. At that equilibrium point, evictions stop, eviction overhead vanishes, Redis rapidly handles its request backlog, and that backlog’s memory gets freed.
- Triggering this cycle requires all of the following:
- Redis is configured with a
maxmemorylimit, and its memory demand exceeds that size. This memory saturation causes evictions to begin. - Redis main thread’s CPU utilization is high enough under its normal workload that having to also perform evictions drives it to CPU saturation. This reduces response rate below request rate, causing a growing request backlog and high latency.
- Many active clients are connected. The duration of the eviction burst and the size of memory spent on client connection buffers increases proportionally to the number of active clients.
- Redis is configured with a
- Prevent this cycle by avoiding either memory or CPU saturation. In our case, avoiding memory saturation was easier (mainly by reducing cache TTL).
Further reading
The following lists summarize the analytical tools and methods cited in this article. These tools are all highly versatile and any of them can provide a massive level-up when working on performance engineering problems.
Tools:
- perf - A Linux performance analysis multitool. In this article, we used
perfas a sampling profiler, capturing periodic stack traces of theredis-serverprocess's main thread when it is actively running on a CPU. - Flamescope - A visualization tool for rendering a
perfprofile (and other formats) into an interactive subsecond heat map. This tool invites the user to explore the timeline for microbursts of activity or inactivity and render flamegraphs of those interesting timespans to explore what code paths were active. - BCC - BCC is a framework for building BPF tools, and it ships with many useful tools out of the box. In this article, we used
funclatencyto measure the call durations of a specific Redis function and render the results as a histogram. - bpftrace - Another BPF framework, ideal for answering ad-hoc questions about your system's behavior. It uses an
awk-like syntax and is quick to learn. In this article, we wrote a custombpftracescript for observing the variables used in computing how much memory to free during each round of evictions. This script's instrumentation points are specific to our particular build ofredis-server, but the approach is able to be generalized and illustrates how versatile this tool can be.
Usage examples:
- Example - Walkthrough of using
perfandflamescopeto capture, filter, and visualize the stack sampling CPU profiles of the Redis main thread. - Example - Walkthrough (including safety check) of using
funclatencyto measure the durations of the frequent calls to functionperformEvictions. - Example - Experiment for adjusting Redis settings
lazyfree-lazy-evictionandmaxmemory-eviction-tenacityand observing the results usingperf,funclatency,funcslower, and the Redis metrics for eviction count and memory usage. - Example - This is a working example (script included) of using
bpftraceto observe the values of a function's variables. In this case we inspected themem_tofreecalculation at the start ofperformEvictions. Also, these companion notes discuss some build-specific considerations. - Example - Describes the latency injection experiment (the first of the three ideas). This experiment confirmed that memory demand increases at the predicted rate when we slow response rate to below request arrival rate, in the same way evictions do. This result confirmed the request queuing itself is the source of the memory pressure that amplifies the eviction burst once it begins.