Published on: May 7, 2019
2 min read
How do you contribute?
Your contribution graph captures a moment in time like few things can, and we want to celebrate it.

Contribution graphs tell the story of your year.
Especially when you’re a daily user, they have a funny way of capturing not only professional milestones, but personal ones too. Vacations, sabbaticals, and family leave are all captured by characteristic little gray squares where no work is done. Equally telling are the times when work overflows into the weekends, or when it forms those satisfyingly deep navy streaks for consecutive days with over 30 commits each.
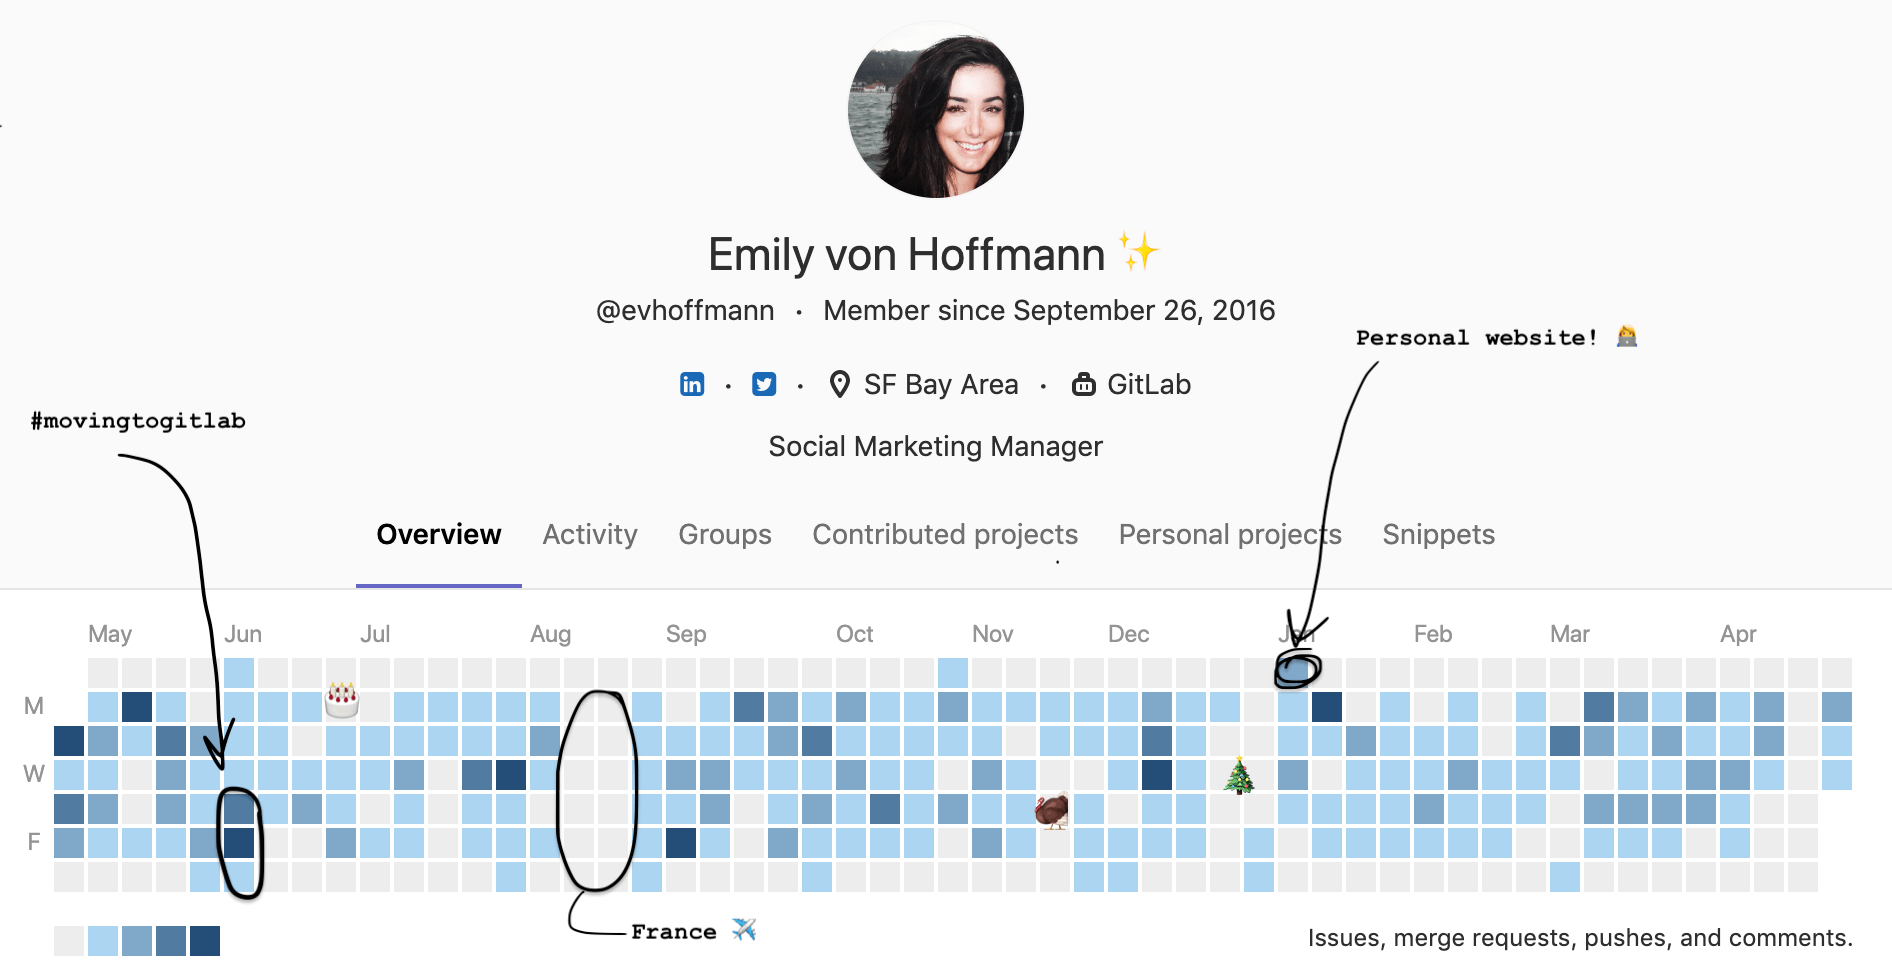
Using GitLab, you don’t just have to commit code in order to get the visual feedback for all of your hard work. Actions like commenting, opening, and closing issues and merge requests are also included. Your contribution graph is as unique as your fingerprint. It captures a moment in time like few things can, and we want to celebrate it. Check out some examples from the GitLab team:
Tackling weekend side projects 🙌
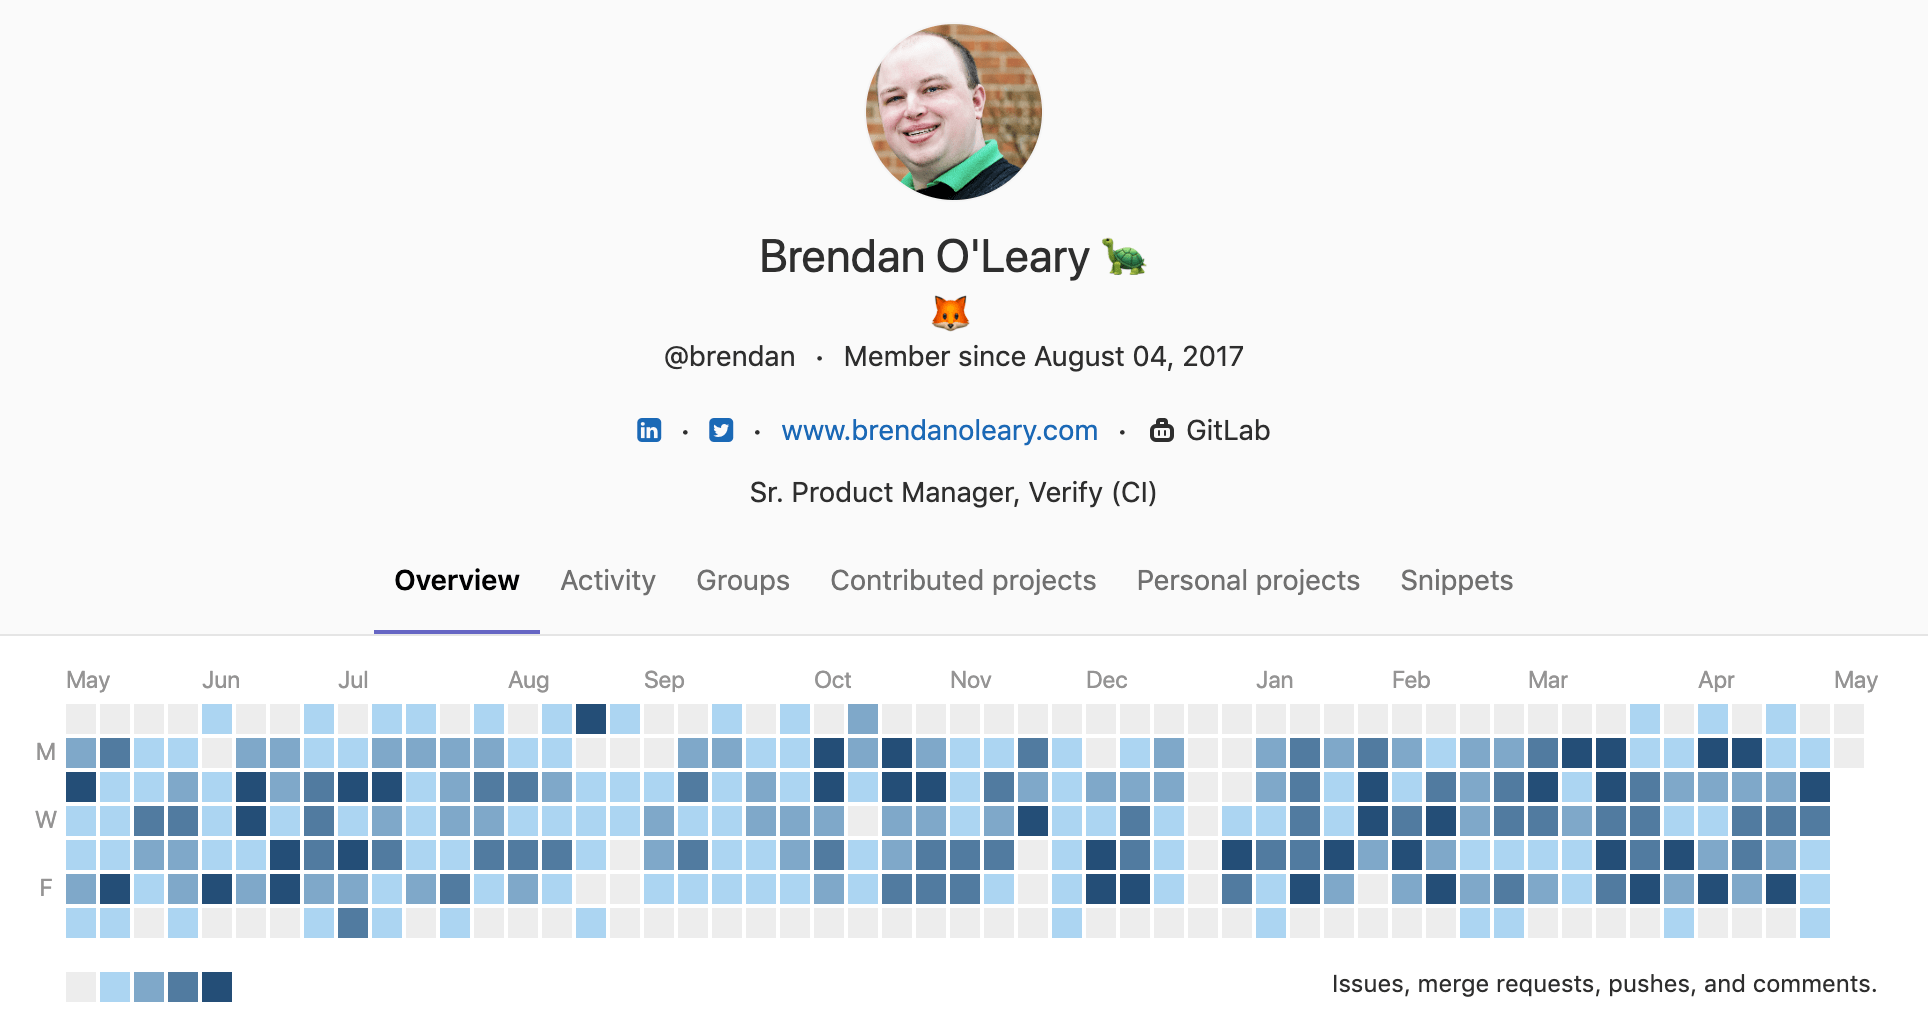
Managing a team 🗣
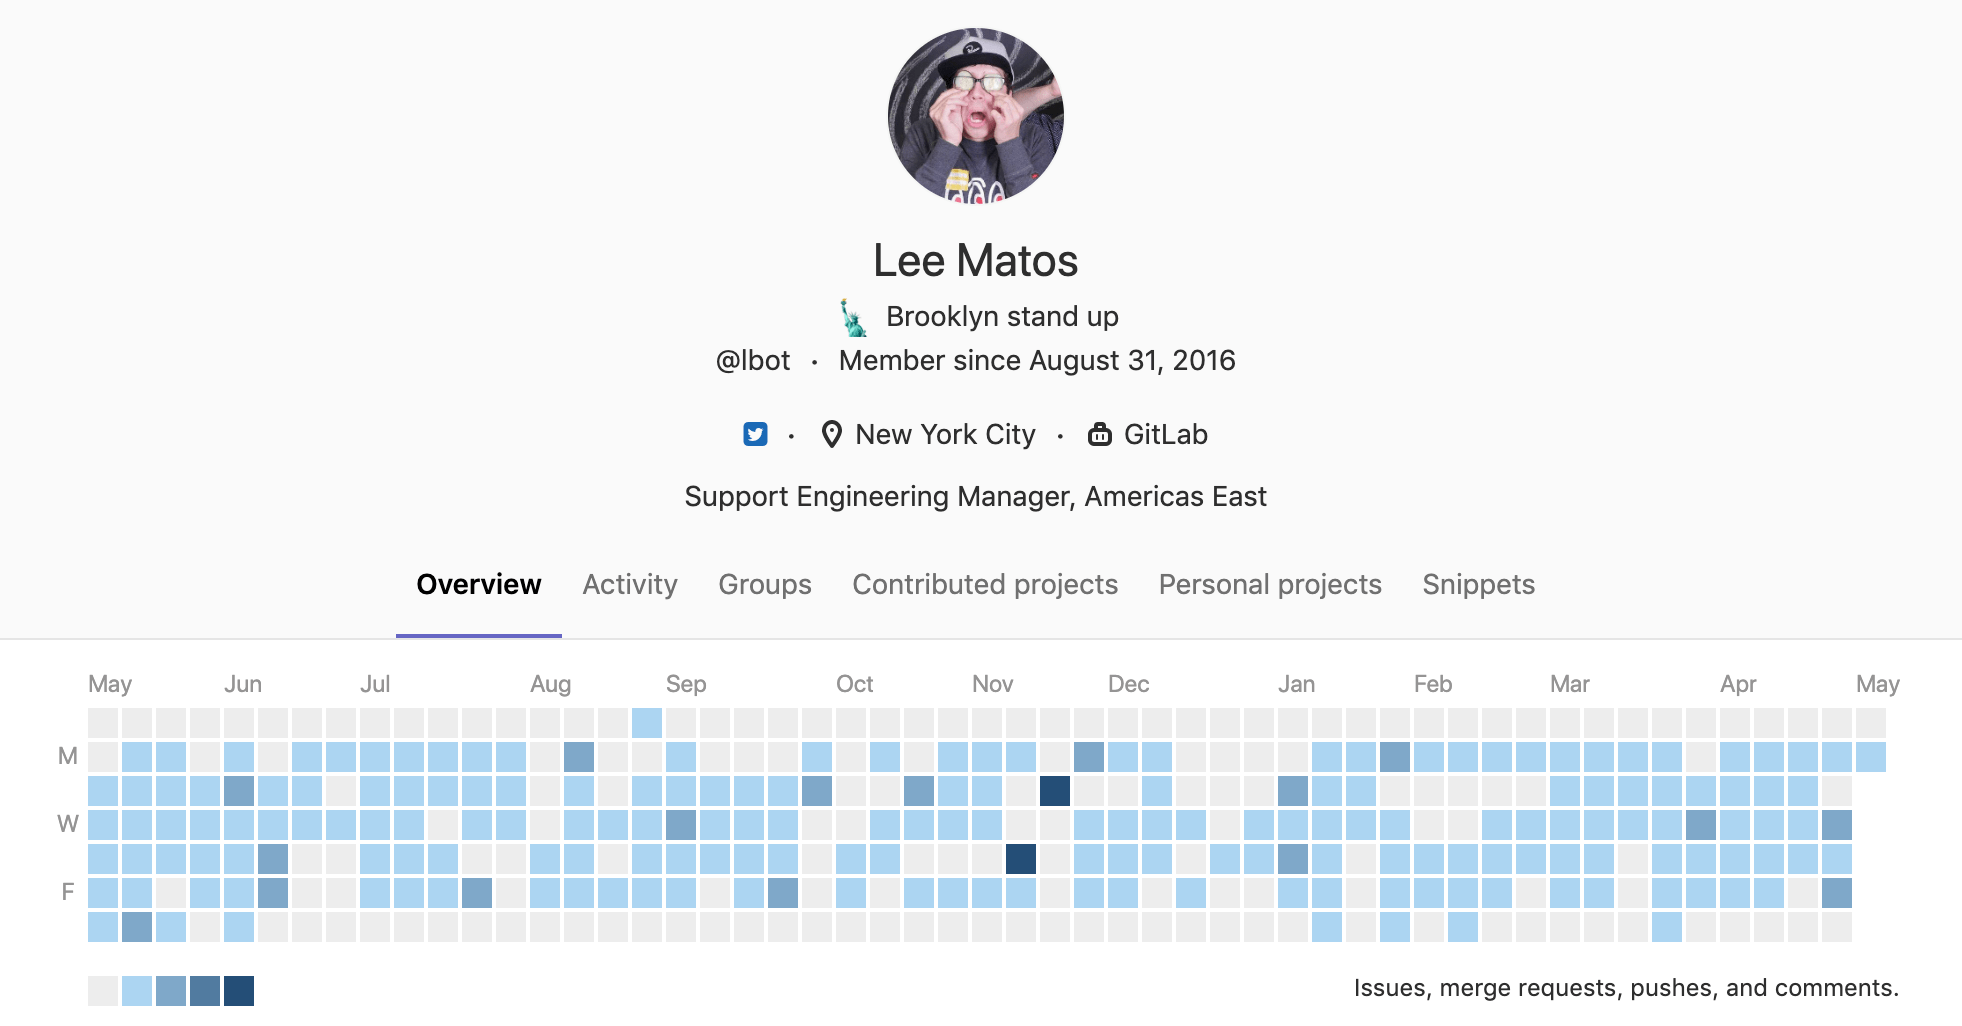
Going on parental leave 🤗
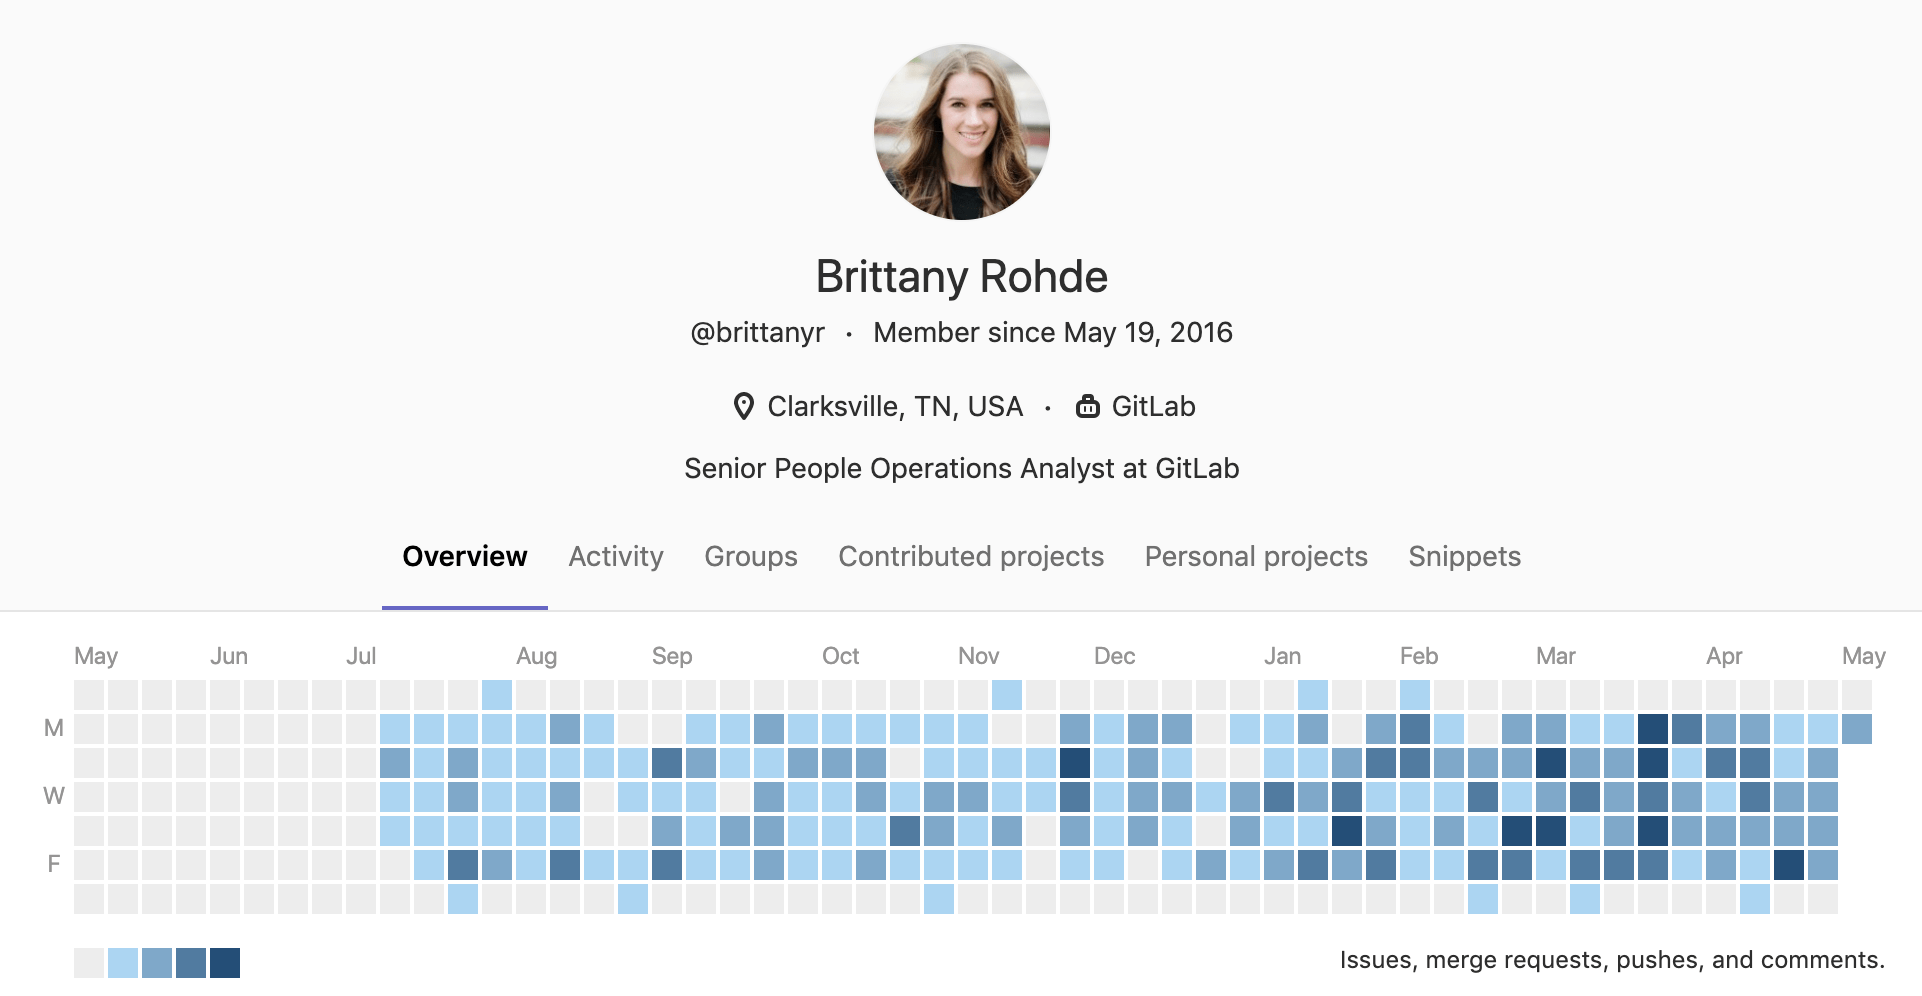
Producing GitLab videos 🎥
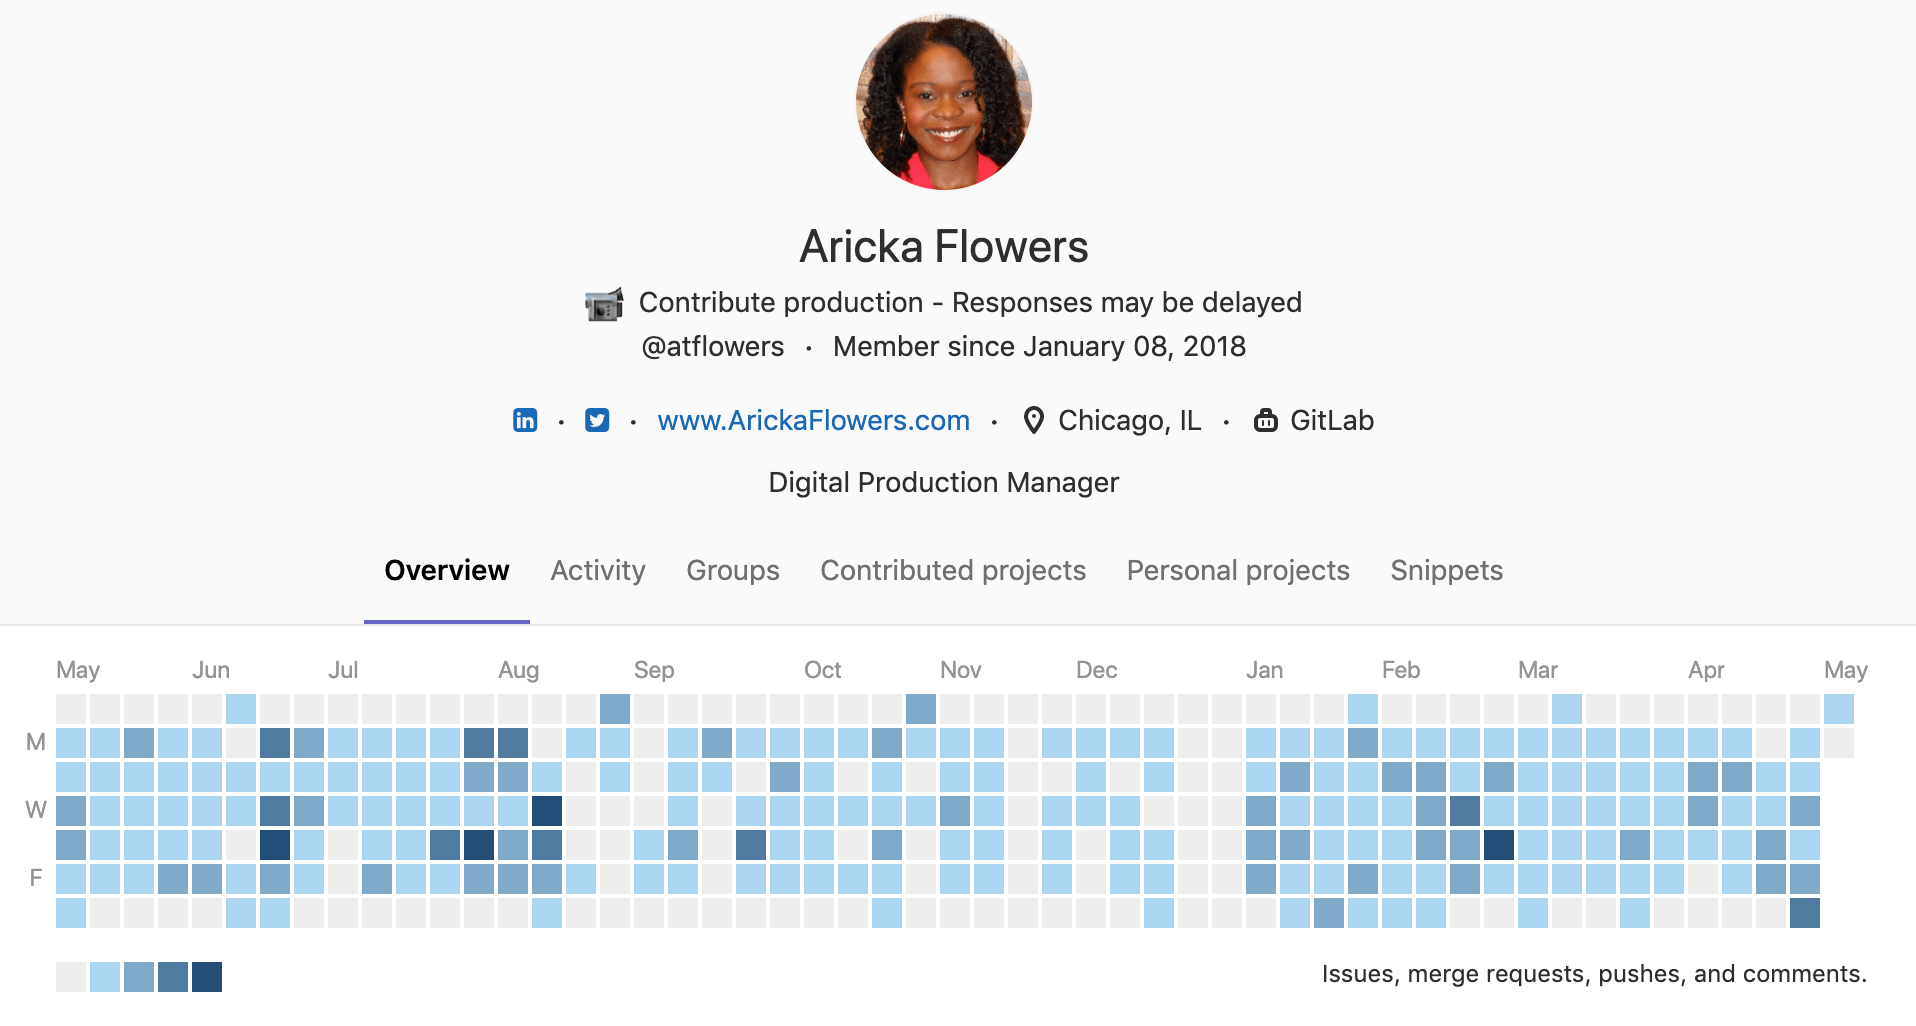
Cultivating perfect weekends 🙏
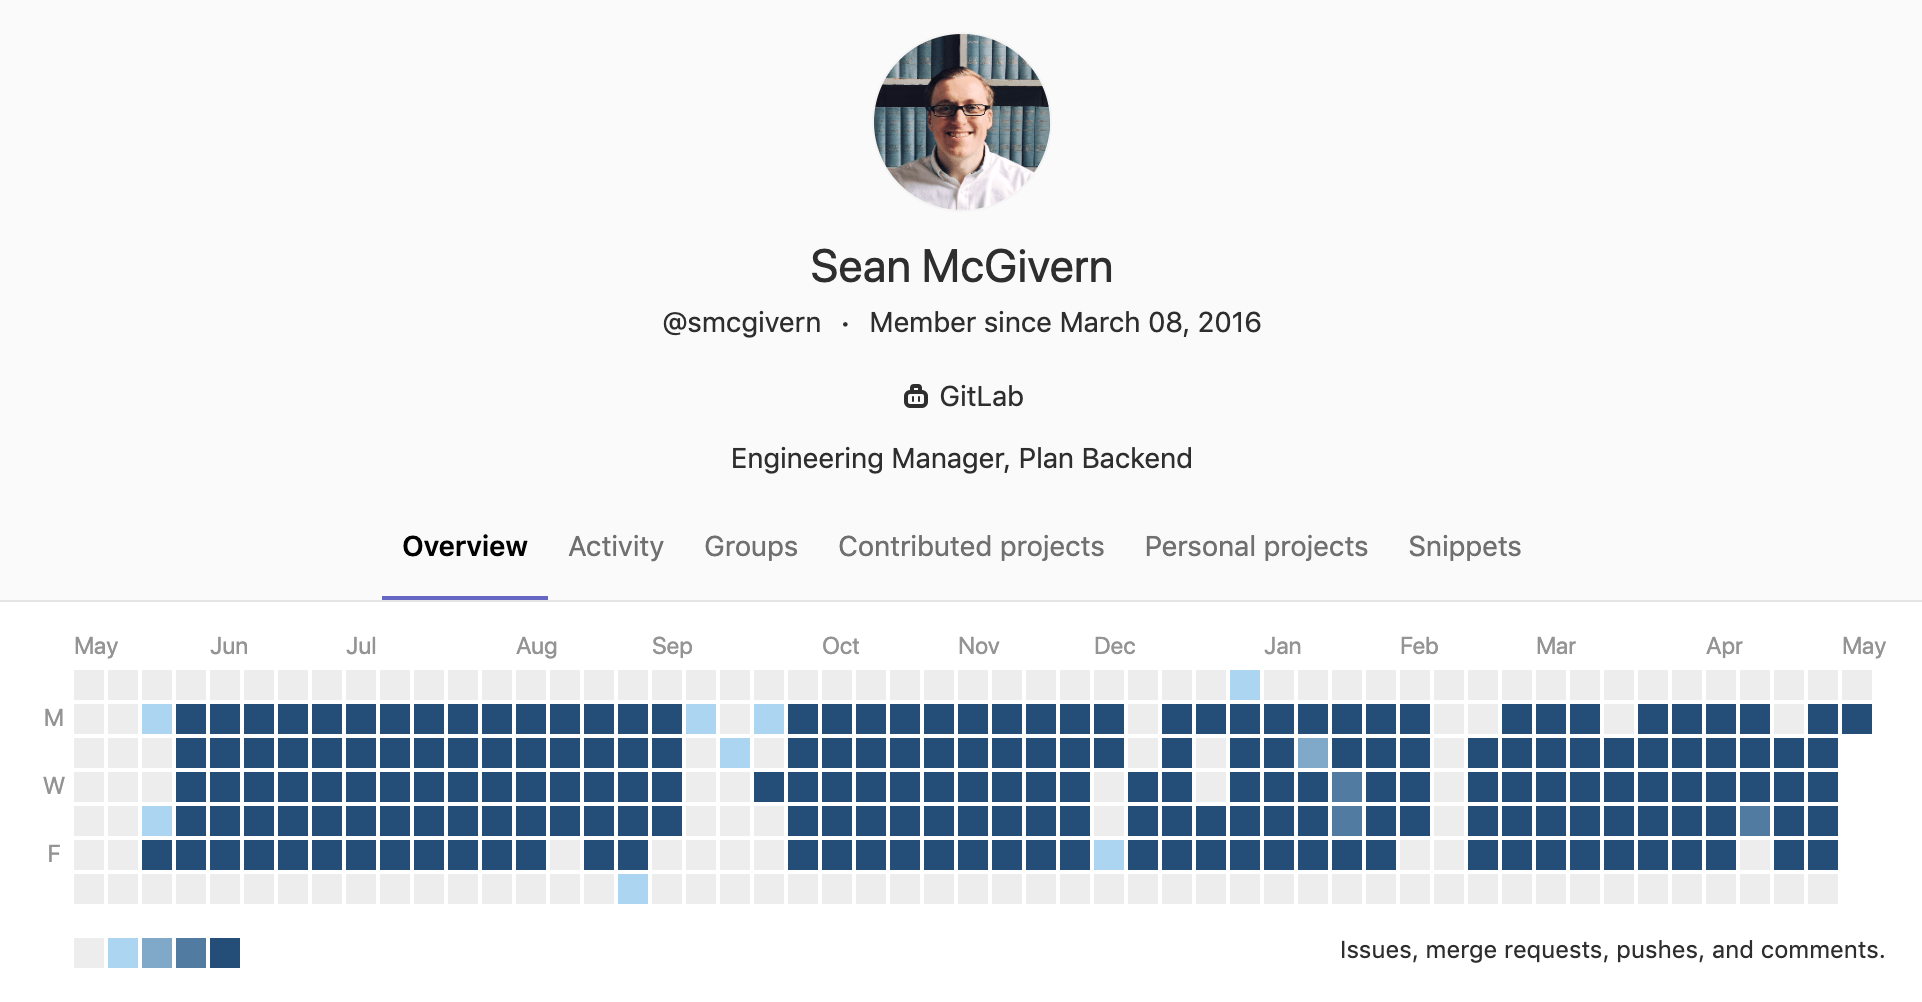
Managing this blog! 📝
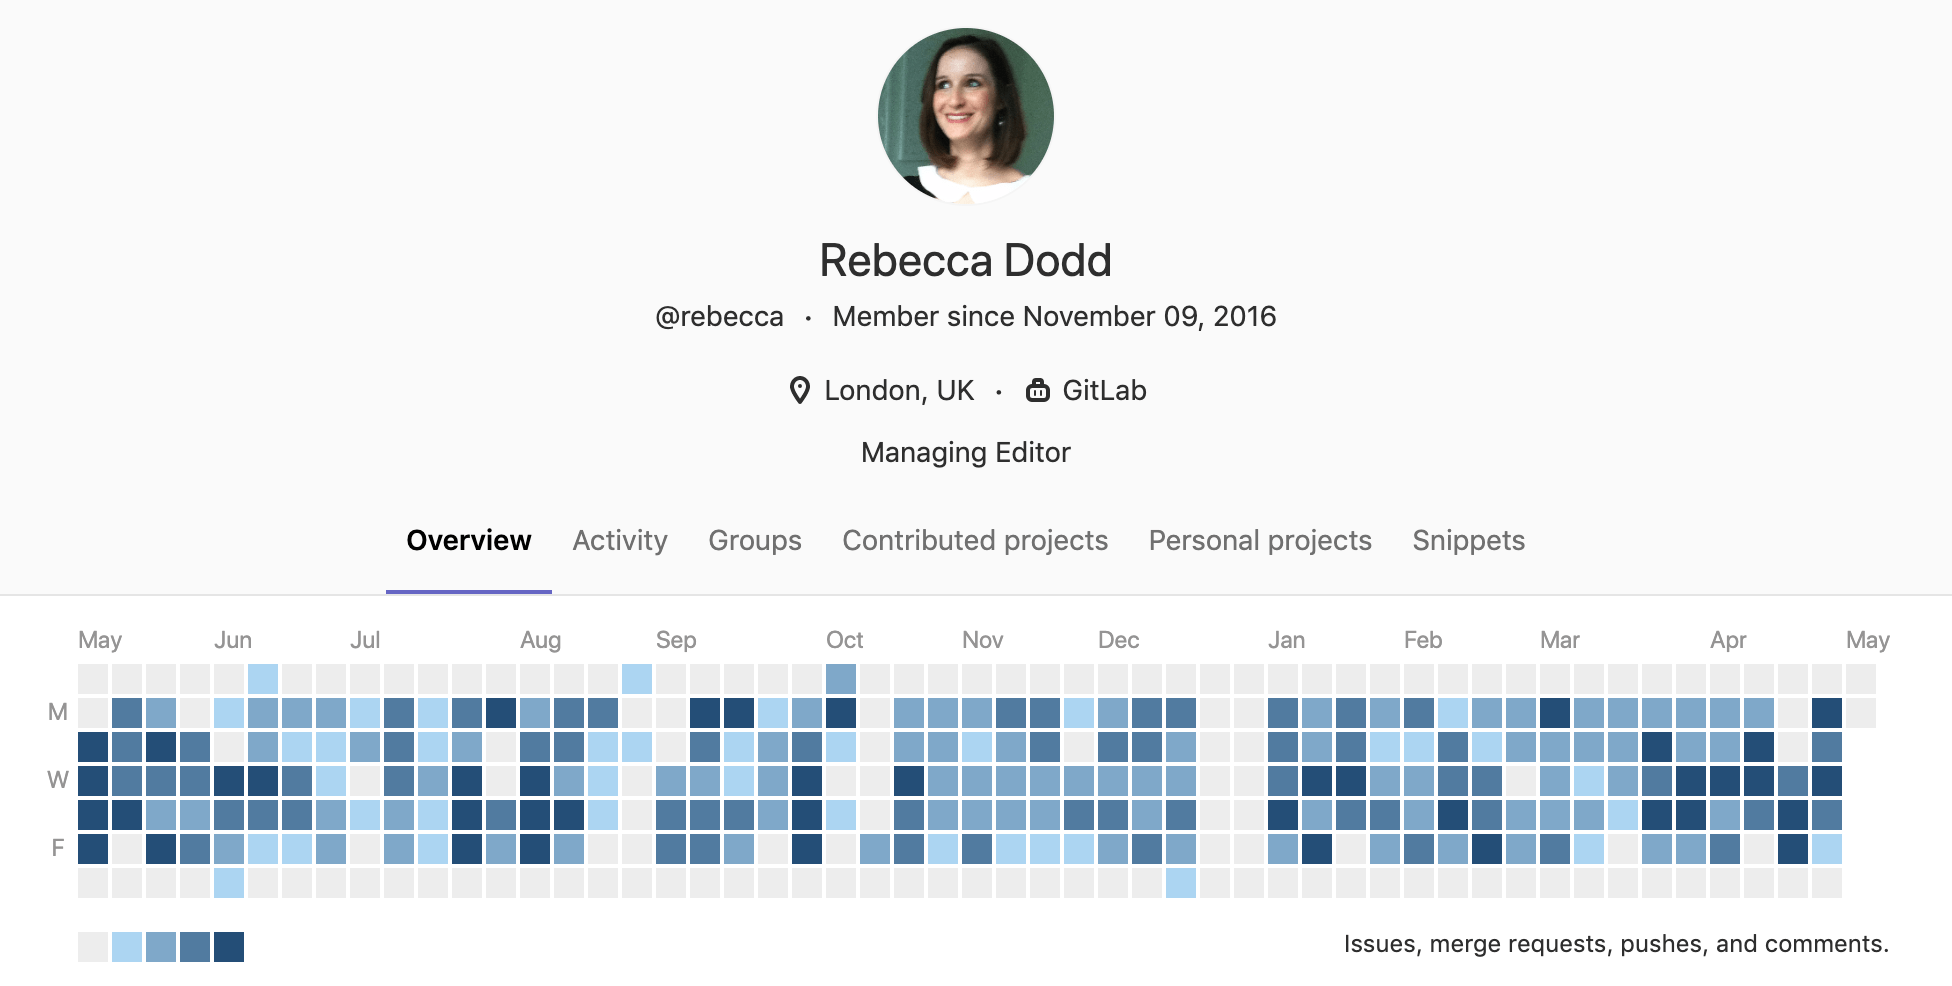
Starting a new job 💜
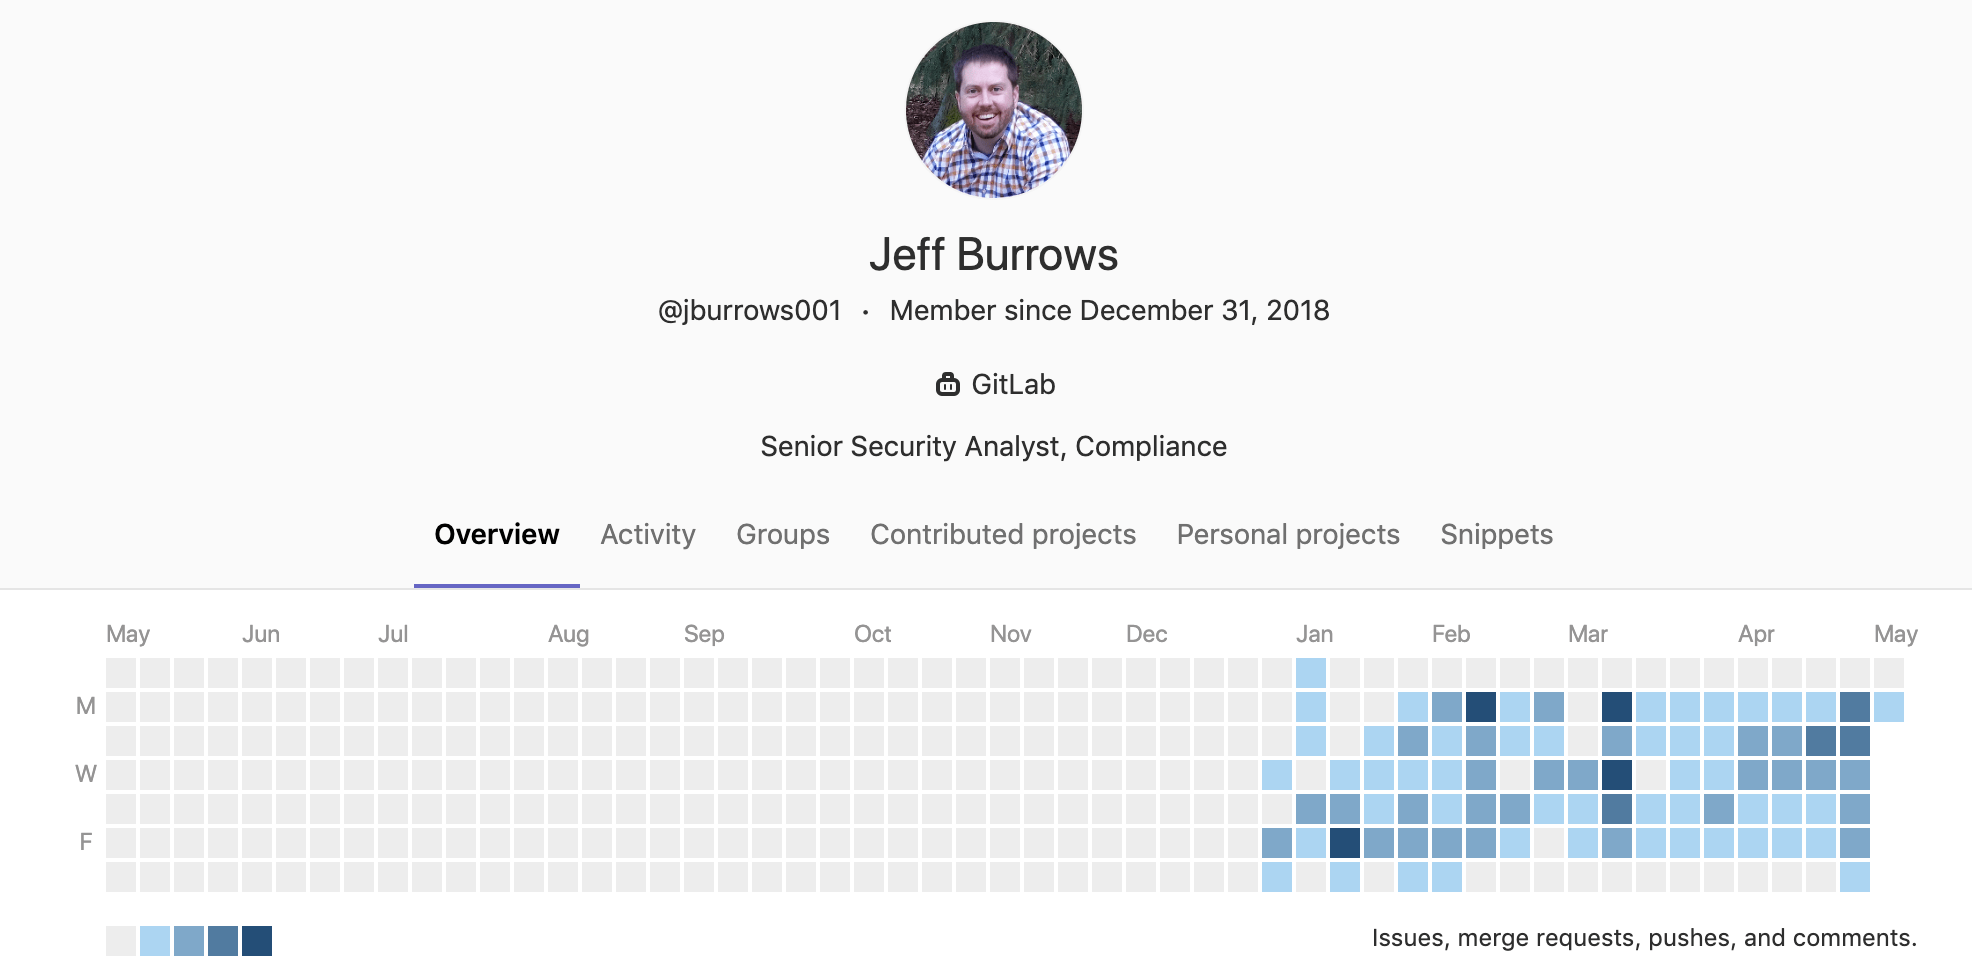
Advancing in your role 💪
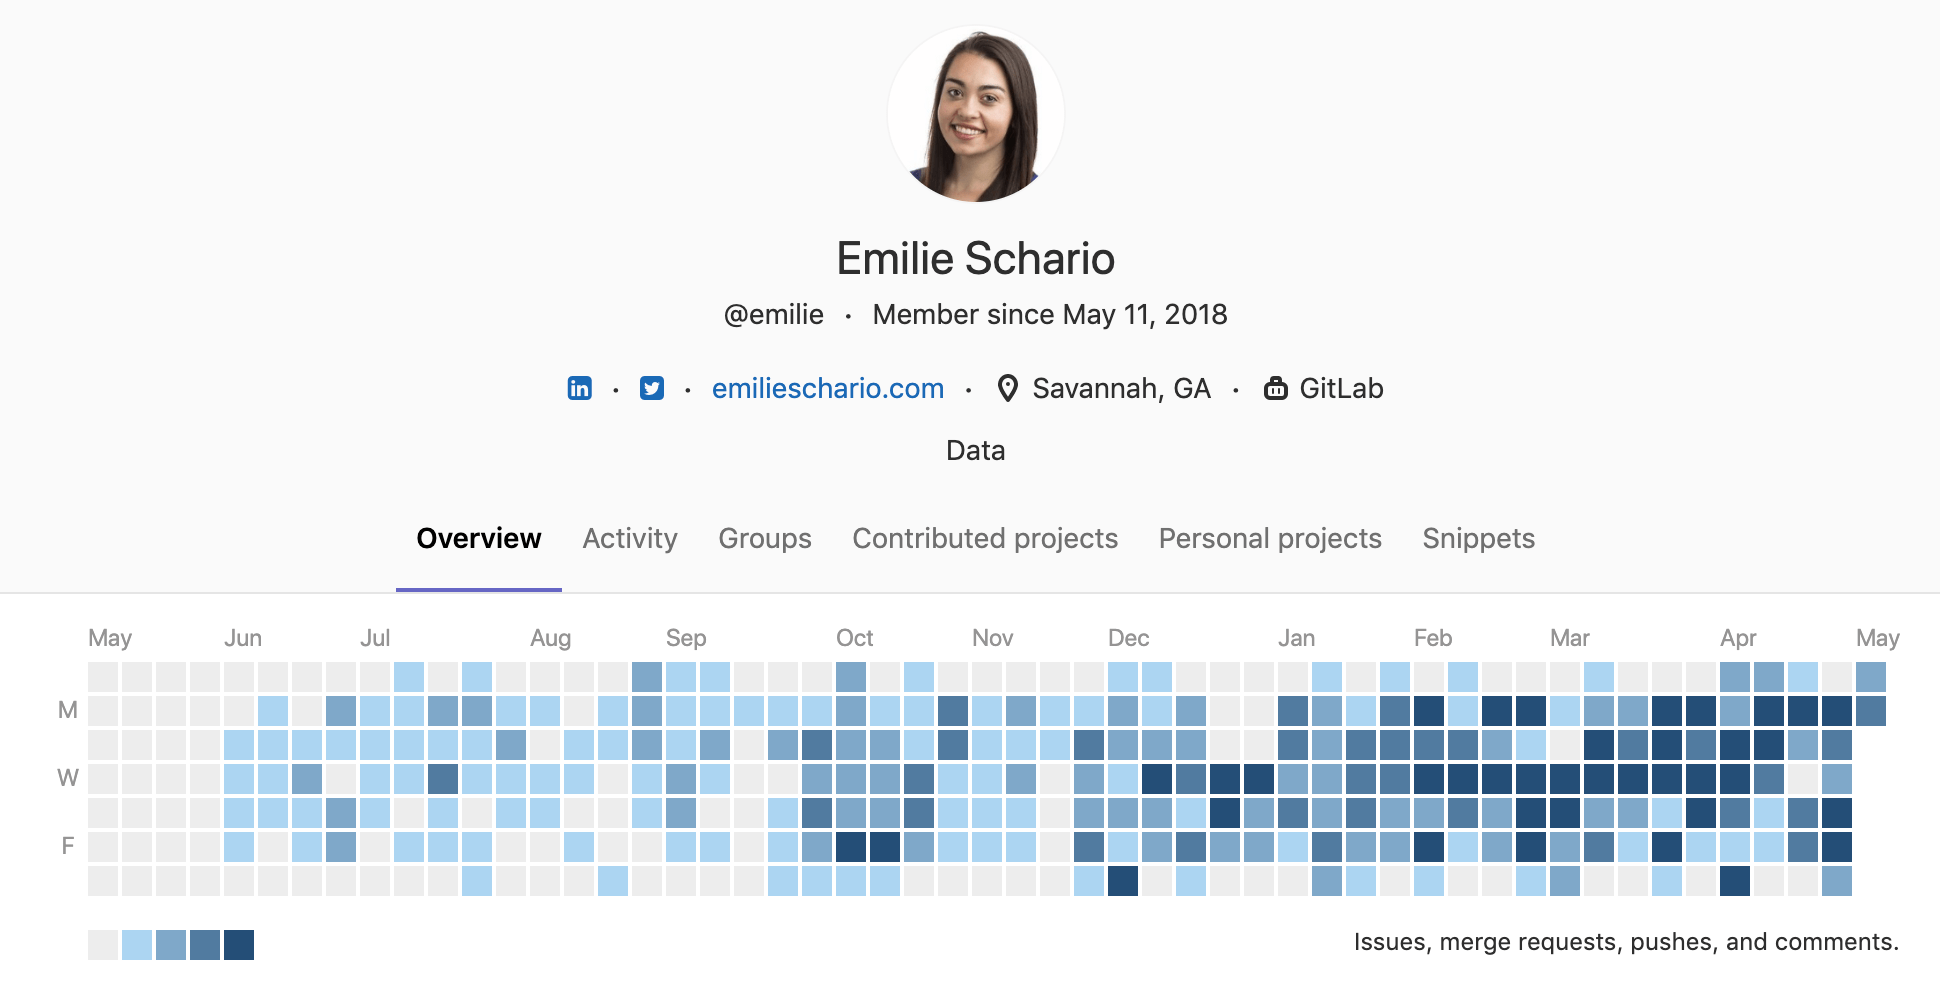
Flexing your skills 💻
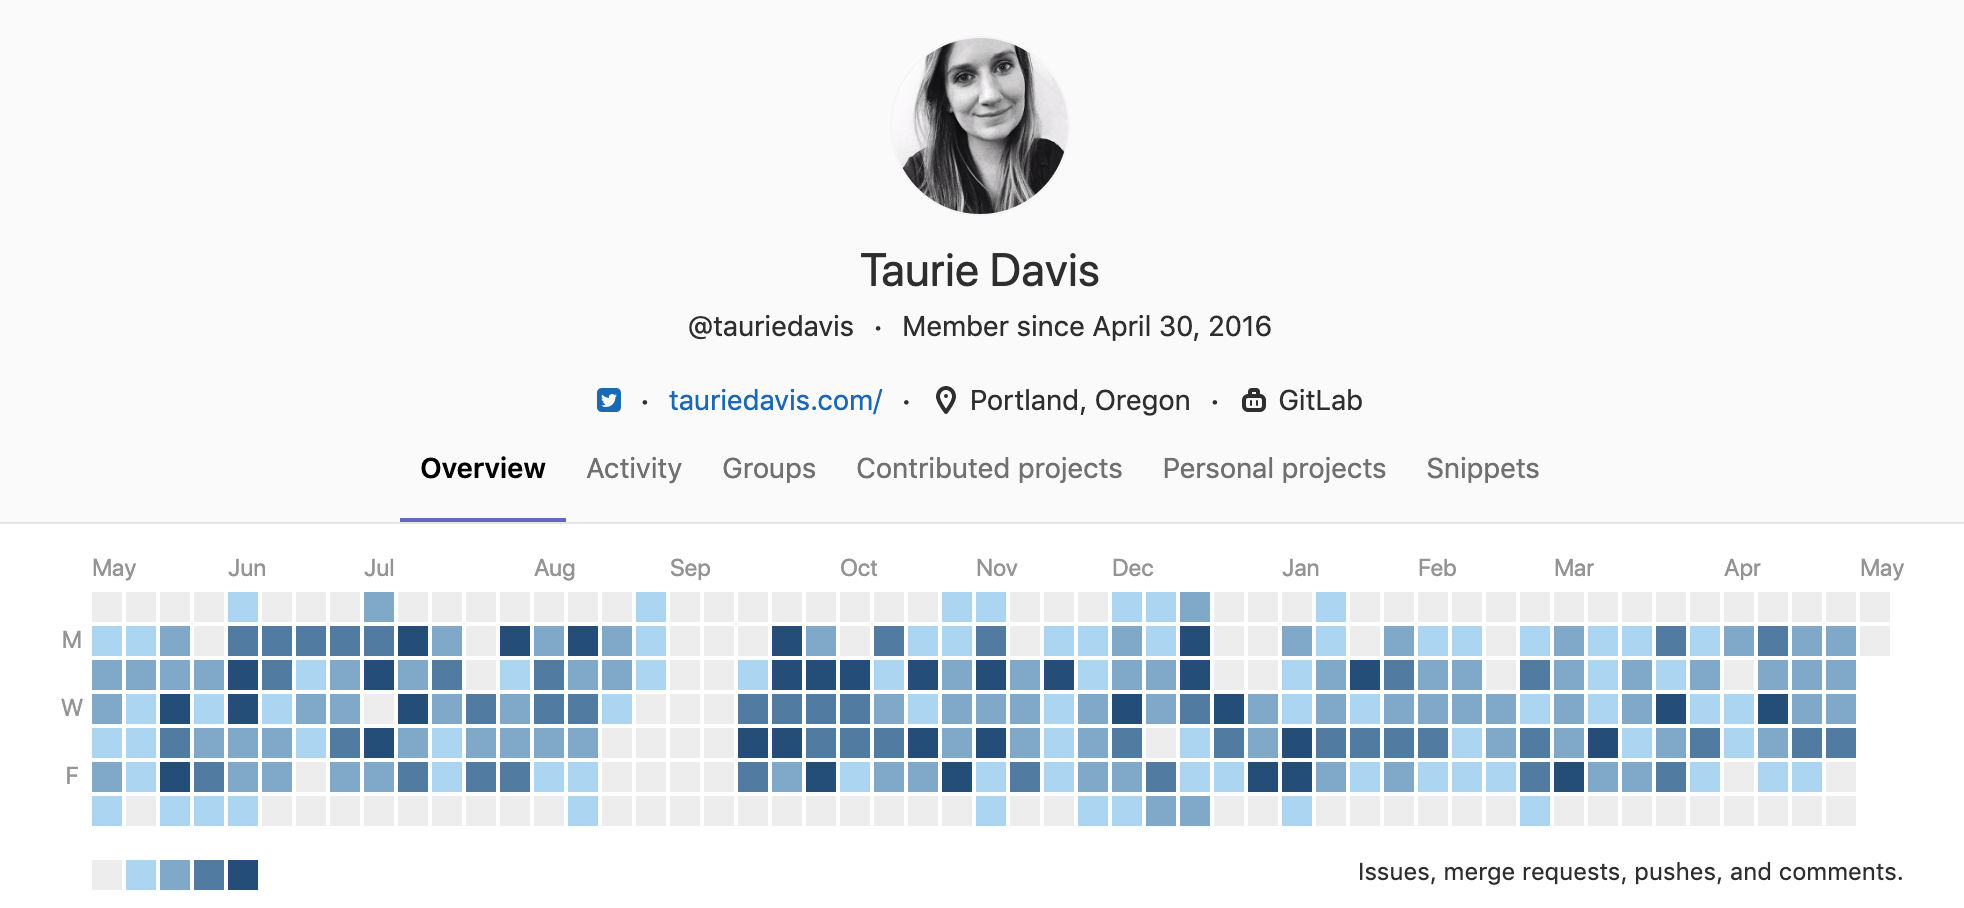
Everyone can #contribute
At GitLab, we believe that everyone can contribute, and that means you! Whether you build software yourself or enable others who do; whether you write code, contracts, or novels; whether you manage a team at work or in your own household, your tasks and timelines can find a home in GitLab.
So tell us about your contributions! While we’re at GitLab Contribute in New Orleans, we want to hear about all the ways that you contribute. Tweet a screenshot of your activity using #contribute, and tell us about your year as represented by your GitLab profile. Tweeting with the hashtag will enter you to win a swag bag to deck you out in GitLab gear from head to toe 😍
We can't wait to hear from you! Tweet us @gitlab.

