Published on: January 11, 2023
8 min read
Monitor your web attack surface with GitLab CI/CD and GitLab Pages
Use this tutorial to build an automated web application screenshot report.

DISCLAIMER: We believe that understanding the tactics and techniques of both attackers and defenders is key to keeping our organization secure. It's important to note that GitLab security blog posts are for informational purposes only, not to provide specific security advice.
Attackers love insecure web applications. Lucky for them, these applications are everywhere! Test environments, development instances, default installations with hardcoded passwords - you name it, it's out there somewhere waiting to be exploited.
The easier it becomes to deploy resources in the cloud, the more of these insecure web applications end up exposed to hacking and/or unintended access. You can get ahead of potential threats by proactively identifying and reviewing your own web application attack surface.
In this tutorial, we'll explain how you can monitor the web applications in your environment by generating a screenshot report using GitLab CI/CD, GitLab Pages, and a handful of free and open source security tools. You'll end up with a fully automated solution that can:
- Identify web services on a list of addresses you own.
- Capture screenshots of these web services.
- Build an authenticated web portal for you to visually see each site that was discovered.
Building the solution
Start with a project
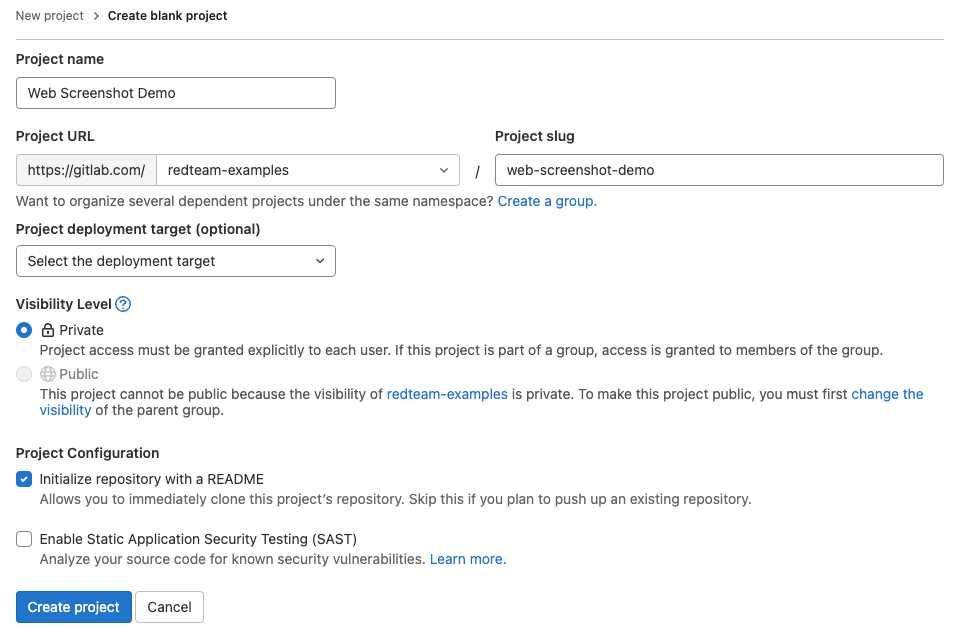
Inside the GitLab web interface, create a blank project. The default settings should be fine, but you should review to confirm that the default settings are appropriate. Pay particular attention to the "Visibility Level" - you may want to set this to private.
 {: .shadow.medium.center}
Write the automation scripts
We'll use three scripts in this project:
setup.sh: Install the required tooling.discover-services.sh: Identify web services using httpx.take-screenshots.sh: Use gowitness to generate a static website containing screenshots of each identified web service.
The HTML generated by gowitness will be placed into the public folder, which is used by GitLab Pages to generate a website you can click through to review the findings.
Each script will generate output files which may be useful for additional analysis. These will be made available as GitLab job artifacts, so that you can download and review them at will.
To complete this step, first create a new folder in your project called scripts. Then, add the following files into that folder:
setup.sh
      #!/bin/bash

# create folder for downloaded binaries
mkdir bin

# install general pre-reqs
apt -qq update > /dev/null
apt -qq install -y wget unzip > /dev/null

# install pre-reqs for gowitness
apt -qq install -y chromium > /dev/null

# download tools
wget -q https://github.com/projectdiscovery/httpx/releases/download/v1.2.5/httpx_1.2.5_linux_amd64.zip
wget -q https://github.com/sensepost/gowitness/releases/download/2.4.2/gowitness-2.4.2-linux-amd64

# unzip / move all relases to bin folder
unzip httpx_1.2.5_linux_amd64.zip -d bin/
mv gowitness-2.4.2-linux-amd64 bin/gowitness
chmod u+x bin/gowitness
discover-services.sh
      #!/bin/bash

# You may want to dynamically generate a target file with each run.
# For this demo, we are using a list defined inside project CI variables.
TARGETS=$TARGET_FILE

# create output directory
mkdir ./targets

# Identify web services
echo "Identifying web services across $(cat "$TARGETS" | wc -l) targets..."
cat "$TARGETS" | bin/httpx -o targets/web-services.txt -p 80,443

echo "Discovered $(cat targets/web-services.txt | wc -l) web services."
take-screenshots.sh
      #!/bin/bash

# Run gowitness
bin/gowitness file -f targets/web-services.txt
bin/gowitness report export -f report.zip

# Move the report to pages outdir
unzip report.zip
mv gowitness public
Set up the pipeline
Next, we need to create the .gitlab-ci.yml file where we configure all of these scripts to run inside a pipeline. Create this file in the root of the project with the following contents:
      stages:
  - scan
  - deploy

scanner:
  image: debian:bullseye
  stage: scan
  script:
  - bash ./scripts/setup.sh
  - bash ./scripts/discover-services.sh
  - bash ./scripts/take-screenshots.sh
  only:
  - schedules
  - web
  artifacts:
    paths:
    - targets
    - public

pages:
  stage: deploy
  script:
  - echo "" # do nothing
  only:
  - schedules
  - web
  artifacts:
    paths:
    - public
This file defines a pipeline with two stages:
- The first stage (
scan) runs all three scripts we created. This will generate a static website inside a folder calledpublic. - The second stage (
deploy) is required for GitLab Pages to work - this is where the static site is published on a publicly-accessible URL that can be configured to require GitLab authentication.
You can see we've added an only condition to both of these stages. This ensures that the tool doesn't run every time you make a change to the code - it runs only on a defined schedule or when you manually choose to run it via the web UI.
Define your targets
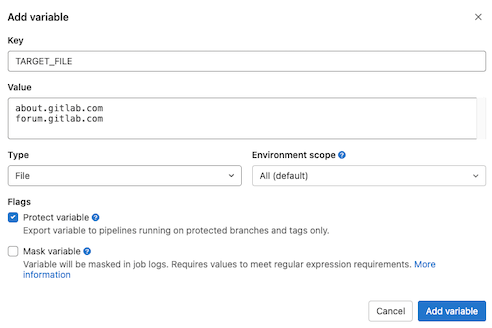
You may have noticed the TARGETS_FILE variable inside the discover-services.sh script from earlier. That's a file variable that will contain the targets you wish to scan. Defining this as a variable allows us to create a generic, portable project that can be forked and cloned without containing any specific targets.
To add some targets to your project, go to "Settings -> CI/CD -> Variables" and click the "Add variable" button. Enter TARGET_FILE for the "Key" and fill in one host name or IP address per line in the "Value" section. Make sure to add a blank line to the end of the list - this is required for the scripts to run correctly.
 {: .shadow.center}
We run a similar version of this screenshot tool internally, and we generate this file dynamically by exporting all of our public addresses from our various cloud environments. If you decide to implement something like that, we'd recommend adding an additional stage to your .gitlab-ci.yaml file.
Schedule and run the pipeline
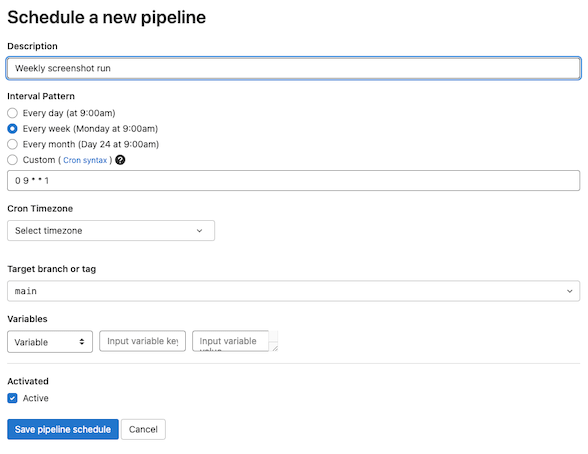
GitLab projects have a built-in scheduler that lets you automatically run pipelines at specific dates/times. You can access this inside your project at "CI/CD -> Schedules". Here, we'll create a new schedule to run once a week on Monday mornings.
 {: .shadow.center}
After saving the schedule, you can also choose to manually run the pipeline by clicking the play button shown below. If you are following along, go ahead and do this now.
 {: .shadow.center}
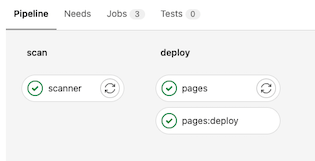
You can follow the progress of your pipeline by navigating to "CI/CD -> Pipelines". Click on the status of the most recent pipeline. Here, you'll see the stages we configured earlier. If all goes well, you'll see green check marks on each stage. You can click on an individual stage to watch the console logs and perform any necessary troubleshooting.
 {: .shadow.center}
Enable notifications
Once you've set up a schedule, you might want to be alerted whenever a new report is ready. Luckily, GitLab has you covered here!
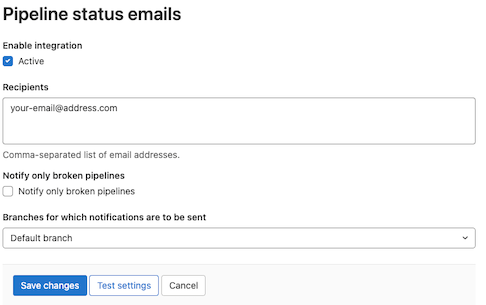
Inside your project, go to "Settings -> Integrations -> Pipeline Status Emails". Put your email address into the "Recipients" field and uncheck the box "Notify only broken pipelines". This will send you an email each time a pipeline completes and a new screenshot report has been published to your GitLab Pages site.
GitLab offers a slew of other notifcation options as well, including things like Slack and Teams. If you prefer one of those, you can read more in the docs.
 {: .shadow.center}
View your GitLab Pages site
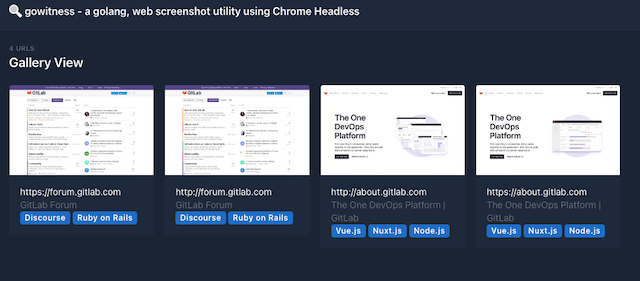
Once the pipeline has completed successfully, your site should be available. You can obtain the site's public address by going to "Settings -> Pages".
If you set your project to be private, then by default only project members who are authenticated to the GitLab server can view the site. You can modify these settings under "Settings -> General -> Visibility, project features, permissions -> Pages".
 {: .shadow.center}
Summary
Web applications are everywhere. Often, they are deployed with vulnerable configurations and are left forgotten - unmonitored and awaiting exploitation. You can build a monitoring solution using GitLab and free, open-source tools that gives you a visual overview of the web apps running in your own environment.
This blog walked you through manually setting this up yourself. You can view our example project here, which was created exactly as decribed above. Feel free to fork or clone that project as a shortcut to setting it up from scratch yourself.
We love to find creative uses for GitLab, and this is one we use ourselves internally. If you've come up with some of your own interesting use cases, we would love to hear about them! Or, if there is anything else you'd like our security team to write about, please do let us know! You can share your thoughts in the comments below or via issues and merge requests on any of our projects.
Thanks for reading!
We want to hear from you
Enjoyed reading this blog post or have questions or feedback? Share your thoughts by creating a new topic in the GitLab community forum.
Share your feedback