Updated on: September 17, 2025
13 min read
Kubernetes overview: Operate cluster data on the frontend
GitLab offers a built-in solution for monitoring your Kubernetes cluster health. Learn more about the technical design and functionality with this detailed guide.


Accessing real-time cluster information is crucial for verifying successful software deployments and initiating troubleshooting processes. In this article, you'll learn about GitLab's enhanced Kubernetes integration, including how to leverage the Watch API for real-time insights into deployment statuses and streamlined troubleshooting capabilities.
What are GitLab's Kubernetes resources?
GitLab offers a dedicated dashboard for Kubernetes to understand the status of connected clusters with an intuitive visual interface. It is integrated into the Environment Details page and shows resources relevant to the environment. Currently, three types of Kubernetes resources are available:
- pods filtered by the Kubernetes namespace
- services
- Flux resource (HelmRelease or Kustomization)
For these resources, we provide general information, such as name, status, namespace, age, etc. It is represented similarly to what the kubectl command would show when run from the Kubernetes cluster. More details can be found when clicking each resource. The side drawer shows the list of labels, annotations, detailed status, and spec information presented as read-only YAML code blocks, and streams real-time Kubernetes events filtered for that specific resource. For pods, users can navigate to a dedicated logs view where they select a container and stream its real-time logs, providing crucial debugging information.
The information provided helps to visualize the cluster state, spot any issues, and debug problematic deployments right away. Users can also take immediate action — deleting failed pods, triggering Flux reconciliation, or suspending/resuming synchronization — all from the same interface without context switching to command-line tools.
Frontend to cluster communication: The GitLab solution
We have developed a range of tools and solutions to enable a seamless connection and management of Kubernetes clusters within GitLab. One of the core components of this system is the GitLab agent for Kubernetes. This powerful tool provides a secure bidirectional connection between a GitLab instance and a Kubernetes cluster. It is composed of two main components: agentk and KAS (Kubernetes agent server).
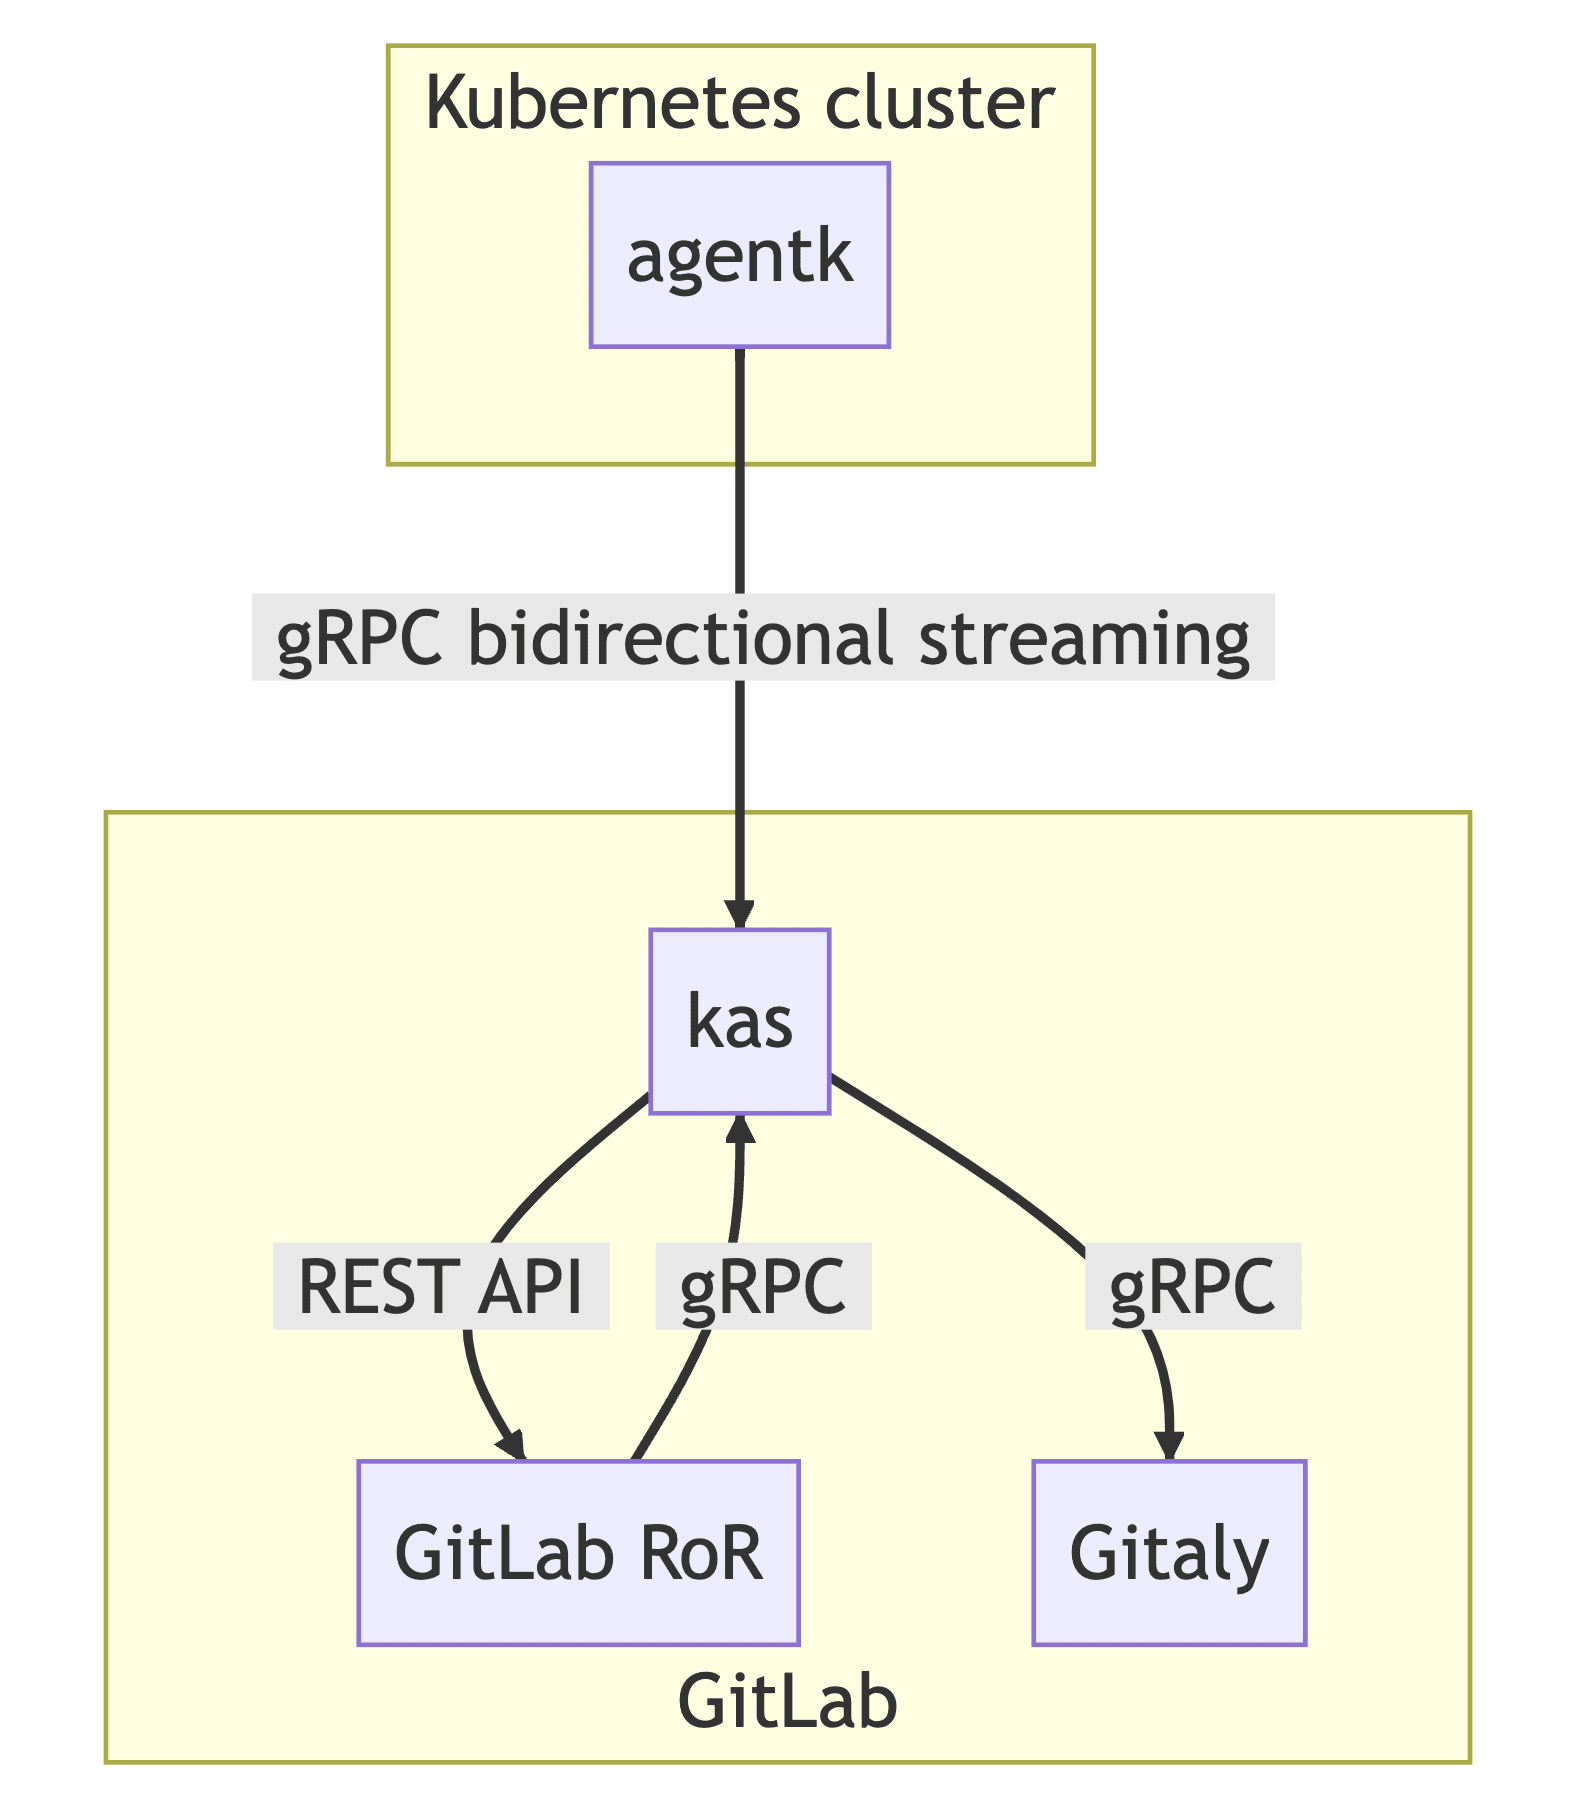
agentk is a lightweight cluster-side component. It is responsible for establishing a connection to a KAS instance and waiting for requests to process. It is proxying requests from KAS to Kubernetes API. It may also actively send information about cluster events to KAS.
While agentk is actively communicating with the cluster, KAS represents a GitLab server-side component. It is responsible for:
- accepting requests from agentk
- authenticating agentk requests by querying GitLab backend
- fetching the agent's configuration from a corresponding Git repository using Gitaly
- polling manifest repositories for GitOps support
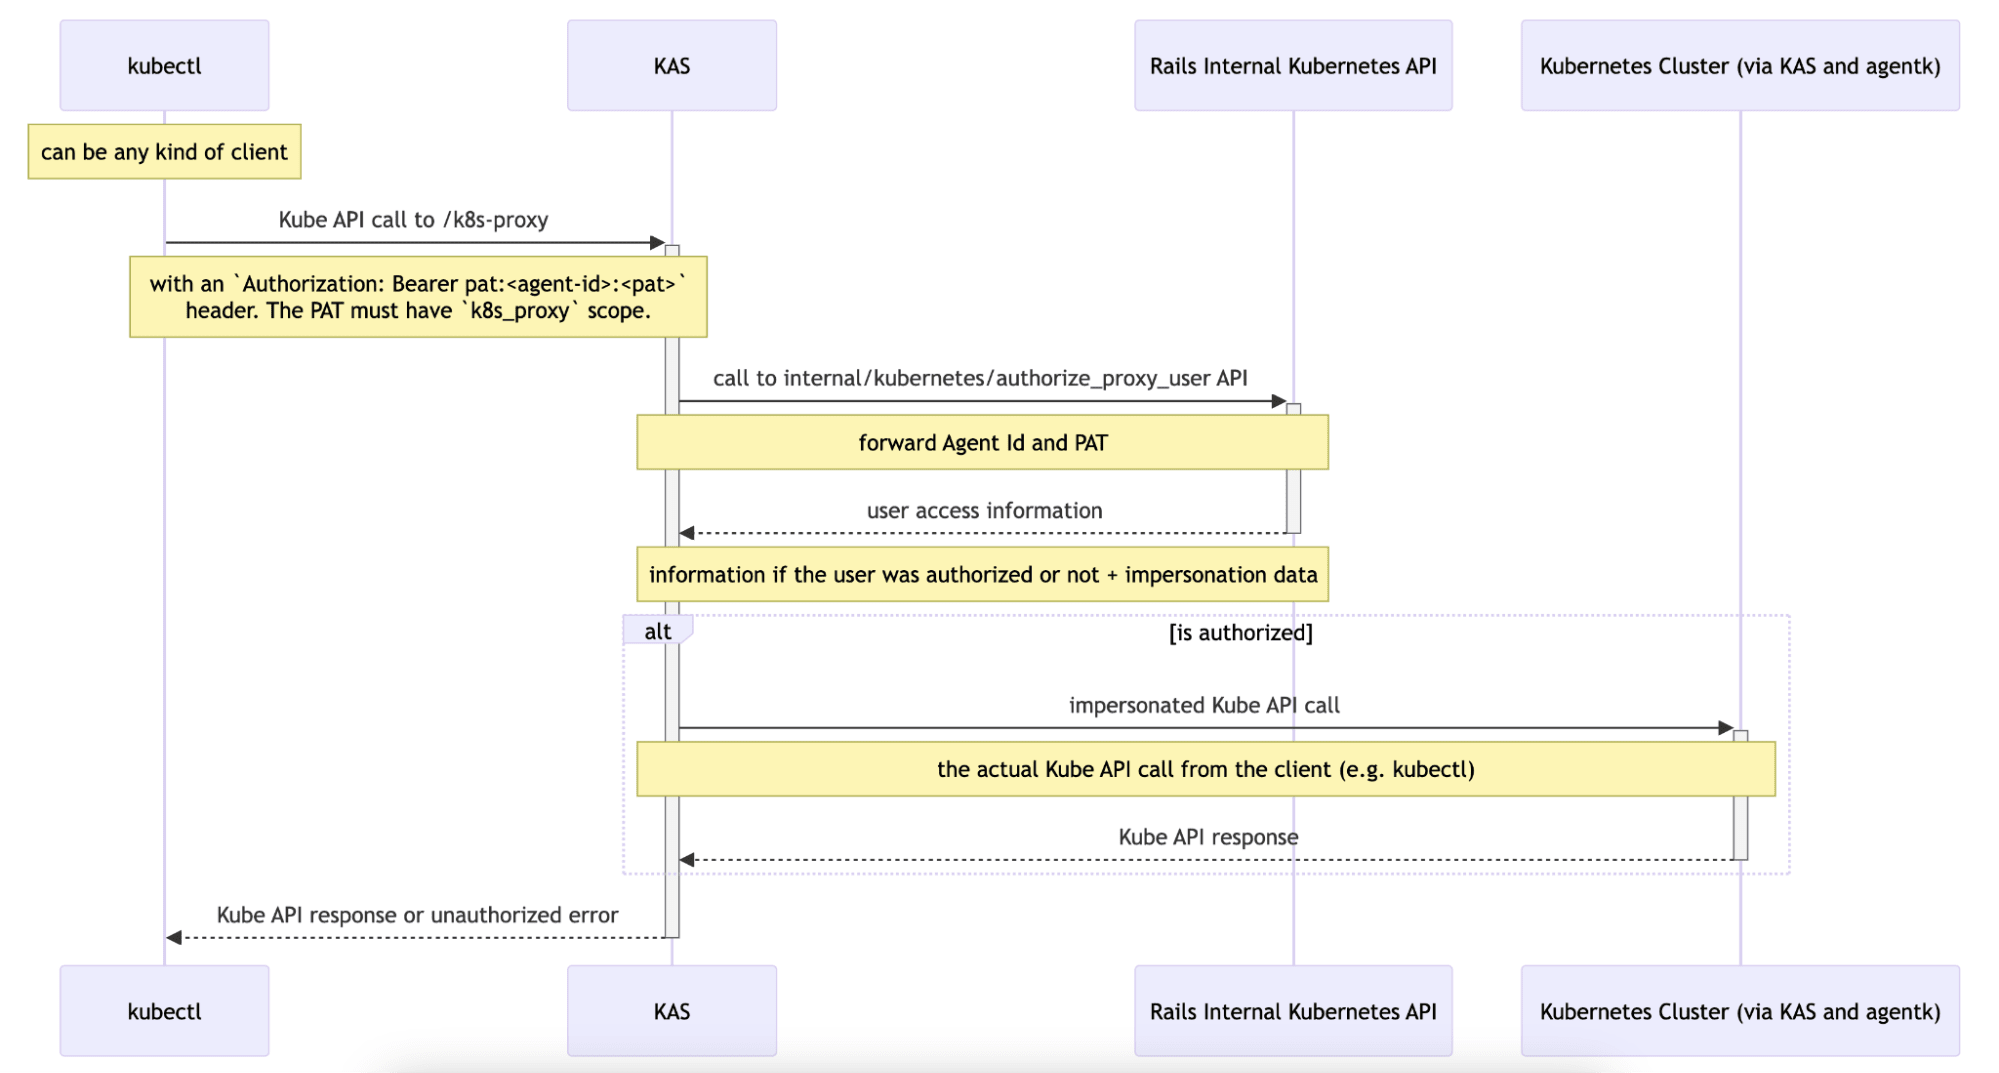
We implemented the agent access rights feature to provide access from the GitLab frontend to the cluster in a secure and reliable way. To enable the feature, the user should update the agent's configuration file by adding the user_access section with the following parameters: projects, groups, and access_as to specify which projects can access cluster information via the agent and how it should authenticate.
Once this is done, the frontend can connect to the cluster by sending a request to the Rails controller, which should set a gitlab_kas cookie. This cookie is then added to the request sent to KAS together with the agent ID and Cross-Site Request Forgery (CSRF) token. Upon receiving the request, KAS checks the user's authorization and forwards it to agentk, which makes an actual request to the Kubernetes API. Then the response goes all the way back from the agentk to KAS and finally to the GitLab client.
To integrate this logic on the GitLab frontend and use it within the Vue app, we developed a JavaScript library: @gitlab/cluster-client. It is generated from the Kubernetes OpenAPI specification using the typescript-fetch generator. It provides all the Kubernetes APIs in a way that can be used in a web browser, along with our WebSocketWatchManager class that handles the Watch Aggregator API for efficient real-time updates.
Introducing the Watch API
The most challenging task is to provide real-time updates for the Kubernetes dashboard. Kubernetes introduces the concept of watches as an extension of GET requests, exposing the body contents as a readable stream. Once connected to the stream, the Kubernetes API pushes cluster state updates similarly to how the kubectl get <resource> --watch command works. The watch mechanism allows a client to fetch the current state of the resource (or resources list) and then subscribe to subsequent changes, without missing any events. Each event contains a type of modification (one of three types: added, modified, or deleted) and the affected object.
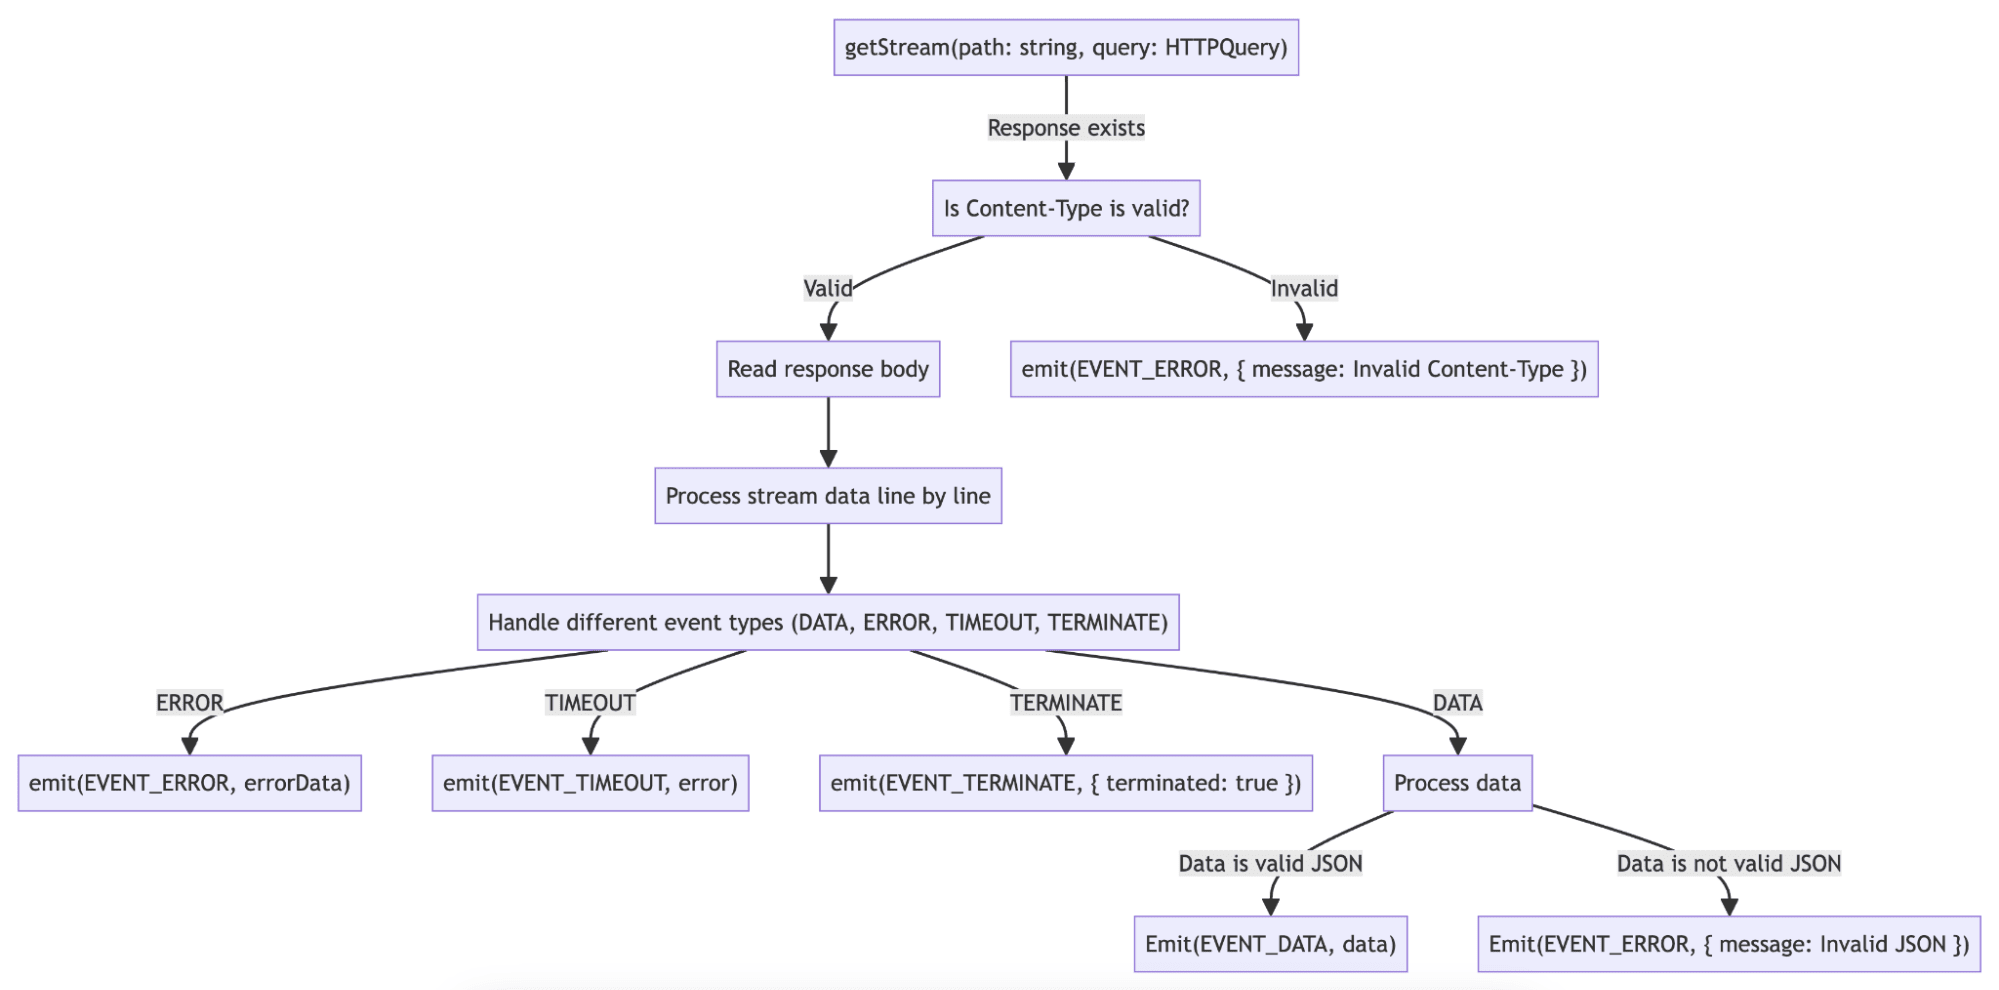
Within the WatchApi class of the @gitlab/cluster-client library, we've developed a systematic approach for interacting with the Kubernetes API. This involves fetching a continuous stream of data, processing it line by line, and managing events based on their types. Let's explore the key components and functionalities of this approach:
- Extending the Kubernetes API: Within the
WatchApiclass, we extend the base Kubernetes API functionality to fetch a continuous stream of data with a specified path and query parameters. This extension enables efficient handling of large datasets, as the stream is processed line by line. 2. Decoding and event categorization: Upon receiving the stream, each line, typically representing a JSON object, is decoded. This process extracts relevant information and categorizes events based on their types. 3. Internal data management: TheWatchApiclass maintains an internal data array to represent the current state of the streamed data, updating it accordingly as new data arrives or changes occur. - The
WatchApiclass implements methods for registering event listeners, such asonData,onError,onTimeout, andonTerminate. These methods allow developers to customize their application's response to events like data updates, errors, and timeouts.
The code also handles scenarios such as invalid content types, timeouts, and errors from the server, emitting corresponding events for clients to handle appropriately. With this straightforward, event-driven approach, the WatchApi class allows developers to create responsive real-time applications efficiently.
Evolution to WebSocket Aggregation
Building on this Watch API foundation, we've introduced the WebSocketWatchManager to address the limitations of readable streams. This enhanced approach uses the gitlab-agent-watch-api WebSocket subprotocol to aggregate multiple resource watches within a single persistent connection, bringing several improvements:
- Multiple watches through one connection: Instead of opening separate HTTP streams for each Kubernetes resource, they all share a single WebSocket connection. This significantly reduces the connection overhead on both client and server, especially important when monitoring numerous resources across different namespaces.
- Dynamic watch management: The protocol supports starting and stopping individual watches on demand through
watchandunwatchmessages. Theunwatchfunctionality isn't yet implemented in the JavaScript client, but once added, it will stop unnecessary watches when users navigate away from resource views. - More reliable connections: WebSocket connections maintain stable, long-lived sessions without the unpredictable drops we experienced with the Watch API's HTTP-based streaming. These streaming connections would sometimes terminate unexpectedly, requiring reconnection logic and potentially missing events during the reconnection window.
When establishing a connection, the client must first request an authentication token because WebSocket connections cannot send custom headers (like CSRF tokens or cookies) after the initial handshake. This token, obtained via a standard HTTP request with full authentication headers, is then embedded in the WebSocket subprotocol header during connection establishment. Once connected to the /watch endpoint, the client starts individual watches by sending messages with resource parameters, and the server streams back watch events as Kubernetes resources change.
The system falls back to the original WatchApi implementation when WebSocket connections fail for any reason — whether due to network infrastructure limitations, connection failures, or authentication issues. This dual approach delivers WebSocket performance benefits where possible, while maintaining full functionality through the Watch API's streaming method when needed. The switch happens automatically, delivering consistent real-time functionality without requiring user awareness or intervention.
How is the Kubernetes overview integrated with the GitLab frontend?
Currently, we have two Kubernetes integrations within the product: the Kubernetes overview section for the Environments and the full Kubernetes dashboard as a separate view. The latter is a major effort of representing all the available Kubernetes resources with filtering and sorting capabilities and a detailed view with the full information on the metadata, spec, and status of the resource. This initiative is now on hold while we are searching for the most useful ways of representing the Kubernetes resources related to an environment.
The Kubernetes overview on the Environments page is a detailed view of the Kubernetes resources related to a specific environment. To access the cluster state view, the user should select an agent installed in the cluster with the appropriate access rights, provide a namespace (optionally), and select a related Flux resource.
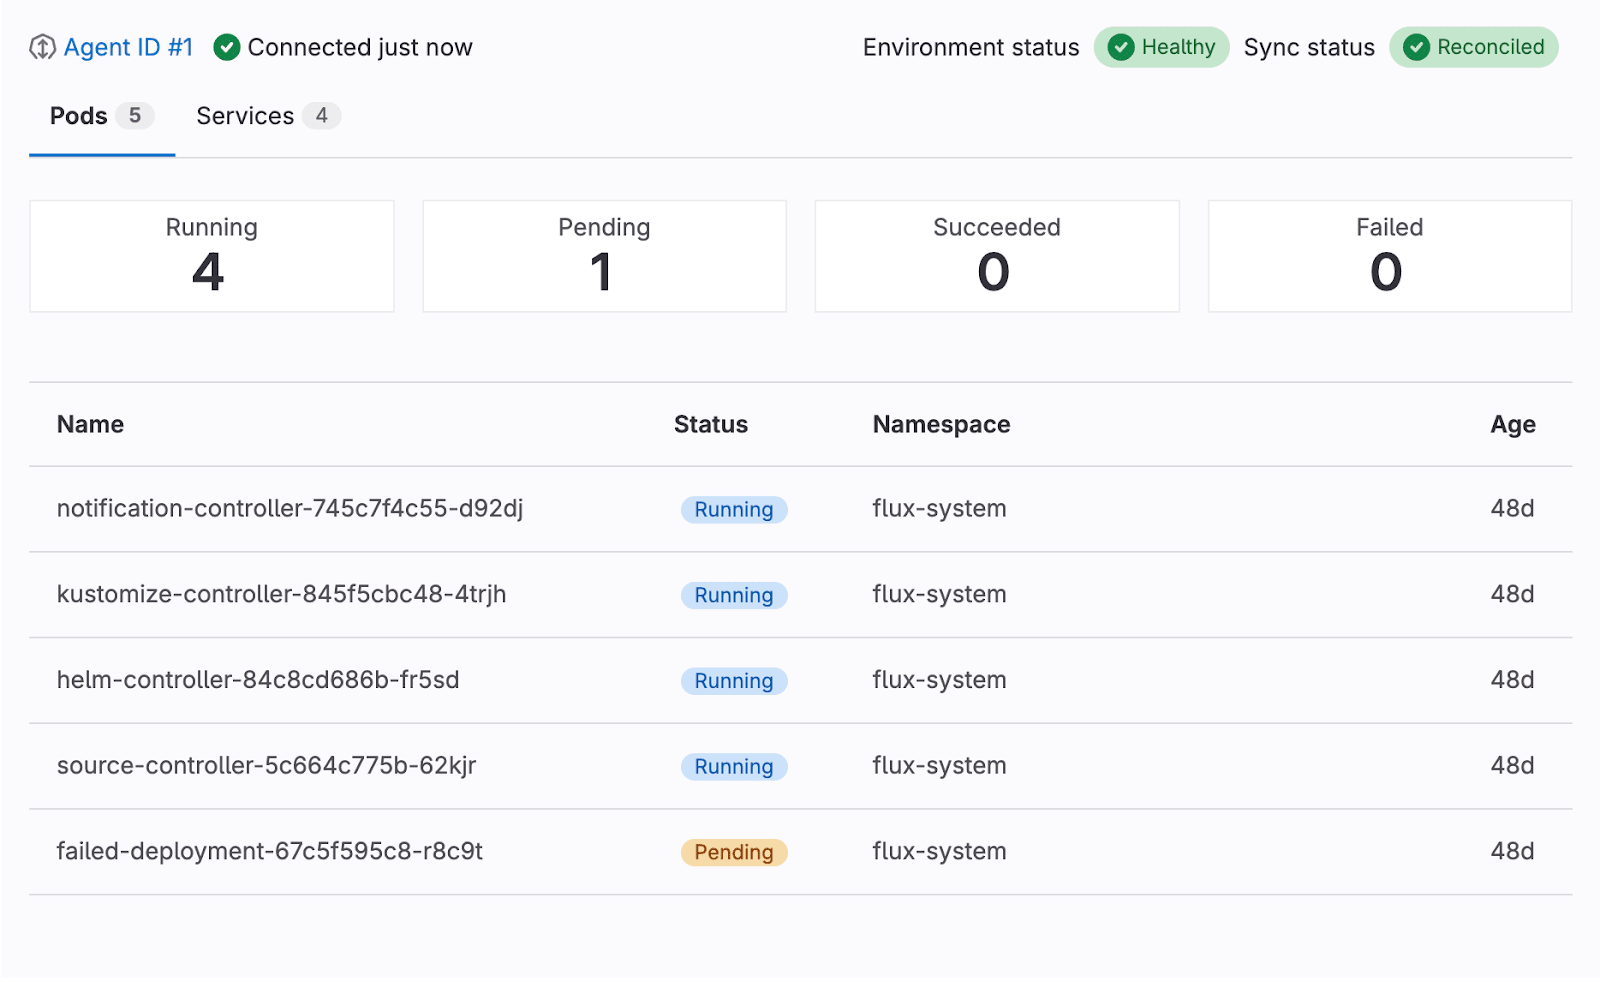
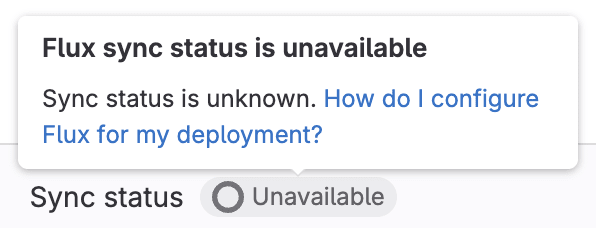
The view renders a list of Kubernetes pods and services filtered by the namespace representing their statuses as well as the Flux sync status. Clicking each resource opens a detailed view with more information for easy issue spotting and high-level debugging.
We need to set up a correct configuration object that will be used for all the API requests. In the configuration, we need to specify the URL provided by the KAS, that proxies the Kubernetes APIs; the GitLab agent ID to connect with; and the CSRF token. We need to include cookies so that the kas_cookie gets picked up and sent within the request.
      createK8sAccessConfig({ kasTunnelUrl, gitlabAgentId }) {
  return {
    basePath: kasTunnelUrl,
    headers: {
      'GitLab-Agent-Id': gitlabAgentId,
      ...csrf.headers,
    },
    credentials: 'include',
  };
}
This configuration object serves as the foundation for all Kubernetes API interactions through KAS, whether using standard API calls, Watch API streaming, or WebSocket connections. Each connection method builds upon this base configuration with its specific requirements.
All the API requests are implemented as GraphQL client queries for efficiency, flexibility, and ease of development. The query structure enables clients to fetch data from various sources in one request. With clear schema definitions, GraphQL minimizes errors and enhances developer efficiency. The WebSocket implementation complements this by managing real-time updates through a single persistent connection, reducing the need for multiple parallel streaming connections while maintaining the same GraphQL query structure for data updates.
When first rendering the Kubernetes overview, the frontend requests static lists of pods, services, and Flux resource (either HelmRelease or Kustomization). The fetch request is needed to render the empty view correctly. If the frontend tried to subscribe to the Watch API stream and one of the resource lists was empty, we would wait for the updates forever and never show the actual result — 0 resources. In the case of pods and services, after the initial request, we subscribe to the stream even if an empty list was received to reflect any cluster state changes. For the Flux resource, the changes that the user would expect the resource to appear after the initial request are low. We use the empty response here as an opportunity to provide more information about the feature and its setup.
After rendering the initial result, the frontend establishes real-time connections to monitor changes. The implementation attempts the WebSocket connection first, falling back to the Watch API streaming when unavailable. With WebSocket connections, a single connection handles all resource watches, which maintains internal streams for each resource and updates them based on incoming events (ADDED, MODIFIED, DELETED). In Watch API fallback mode, the frontend makes requests with the ?watch=true query parameter, creating separate watchers for each event type:
      watcher.on(EVENT_DATA, (data) => {
  result = data.map(mapWorkloadItem);
  client.writeQuery({
    query,
    variables: { configuration, namespace },
    data: { [queryField]: result },
  });

  updateConnectionStatus(client, {
    configuration,
    namespace,
    resourceType: queryField,
    status: connectionStatus.connected,
  });
});
Both approaches follow the same data processing pattern:
- Transform the data to ensure a consistent structure
- Update the Apollo cache to trigger UI updates
- Run a mutation to update the connection status indicator
As we show the detailed information for each resource, we rely on having the status, spec, and metadata fields with the annotations and labels included. The Kubernetes API wouldn't always send this information, which could break the UI and throw errors from the GraphQL client. We transform the received data first to avoid these issues. We also add the __typename so that we can better define the data types and simplify the queries by reusing the shared fragments.
After data stabilization, we update the Apollo cache so that the frontend re-renders the views accordingly to reflect cluster state changes. Interestingly, we can visualize exactly what happens in the cluster — for example, when deleting the pods, Kubernetes first creates the new ones in the pending state, and only then removes the old pods. Thus, for a moment, we can see double the amount of pods. We can also verify how the pods proceed from one state to another in real-time. This is done with the combination of added, deleted, and modified events received from the Kubernetes APIs and processed by either the WebSocketWatchManager or the WatchApi class of the @gitlab/cluster-client library.
The connection status indicator remains important for both connection types, though for different reasons. With WebSocket connections, while they're more stable and long-lived, users still need to know if the connection drops due to network issues or authentication expiry. With Watch API streaming, the connections have timeout limitations and are more prone to disconnection. To achieve this visibility, we introduced a k8sConnection query together with the reconnectToCluster mutation. The UI displays a badge with a tooltip showing three connection states:
- Connecting: Set when initiating either the connection
- Connected: Updated when the first data arrives through either connection type
- Disconnected: Triggered when WebSocket connections fail, Watch API streams timeout, or any connection errors occur
When disconnection occurs, users can click to reconnect without refreshing the browser. Relying on the user action to reconnect to the stream helps us save resources and only request the necessary data while ensuring the accurate cluster state is available for the user at any time.
What's next?
Leveraging the Kubernetes built-in functionality for watching the Readable stream helped us to build the functionality quickly and provide the Kubernetes UI solution to our customers, getting early feedback and adjusting the product direction. The initial Watch API approach, while presenting challenges like connection timeouts and reconnection needs, gave us valuable insights into real-world usage patterns. The WebSocket implementation has addressed many of these initial challenges, providing more stable connections and better resource efficiency through multiplexed watches. Both the Watch API and WebSocket approaches continue to evolve based on user needs.
There are opportunities for enhancement that could improve the user experience further. The WebSocket protocol already supports unwatch messages for dynamic watch management, though this isn't yet implemented in the JavaScript client. Fuller error handling and support for additional Kubernetes resource types could also expand the dashboard's capabilities.
If you're interested in contributing to the Kubernetes dashboard functionality, exploring enhancement opportunities, or sharing your use cases, join the discussion in our Kubernetes Dashboard epic.
Curious to learn more or want to try out this functionality? Visit our Kubernetes Dashboard documentation for more details and configuration tips.
We want to hear from you
Enjoyed reading this blog post or have questions or feedback? Share your thoughts by creating a new topic in the GitLab community forum.
Share your feedback