
If you're new to the series, checkout Part 1: A Gentle(ish) Introduction
Reading time: 12 minutes, 8 seconds
The Problem Of The Tree Swing
“The most powerful ways to influence the behavior of a system is through its purpose or goal. That’s because the goal is the direction-setter of the system, the definer of discrepancies that require action, the indicator of compliance, failure, or success toward which balancing feedback loops work.” -- Thinking In Systems
The working group sat down with the leadership and department heads; things were tense. The CEO announced some major news -- the board planned to start cutting R&D budget in an attempt to drive profitability. A hiring freeze would be put into effect if profitability wasn't achieved within the next fiscal year. The board would also be considering a massive round of layoffs as an extreme measure. Everyone in the room understood the stark reality of the situation. There was a fundamental problem in how the company was operating.
As discussions progressed, the team reviewed the dozens of major initiatives that had shipped over the last several quarters. As they went through these one-by-one, it was not immediately clear how they impacted business outcomes. Sales said that they were all the things customers requested. Product said they talked to the customers and had a validation process for work items during the planning stage. Someone from the working group asked a focusing question -- how does Acme understand how a product capability is used once it has been delivered to a customer? The roadmap was supposedly organized by needs that customers had expressed, but nothing was linking them to quantifiable changes in customer behavior that would result in specific business outcomes.
Product said they measured certain kinds of activities, but it didn't help them get a clear sense of whether something was working or not. Sales said that account managers regularly checked in with customers and kept track of the feedback. Customer support mentioned they share tickets with product from time-to-time. To grasp where the root issues were in the product, the team decided to call customers that requested features but hadn't fully adopted them. After dozens of interviews and ethnographic observations, everyone started to see a common pattern emerge.
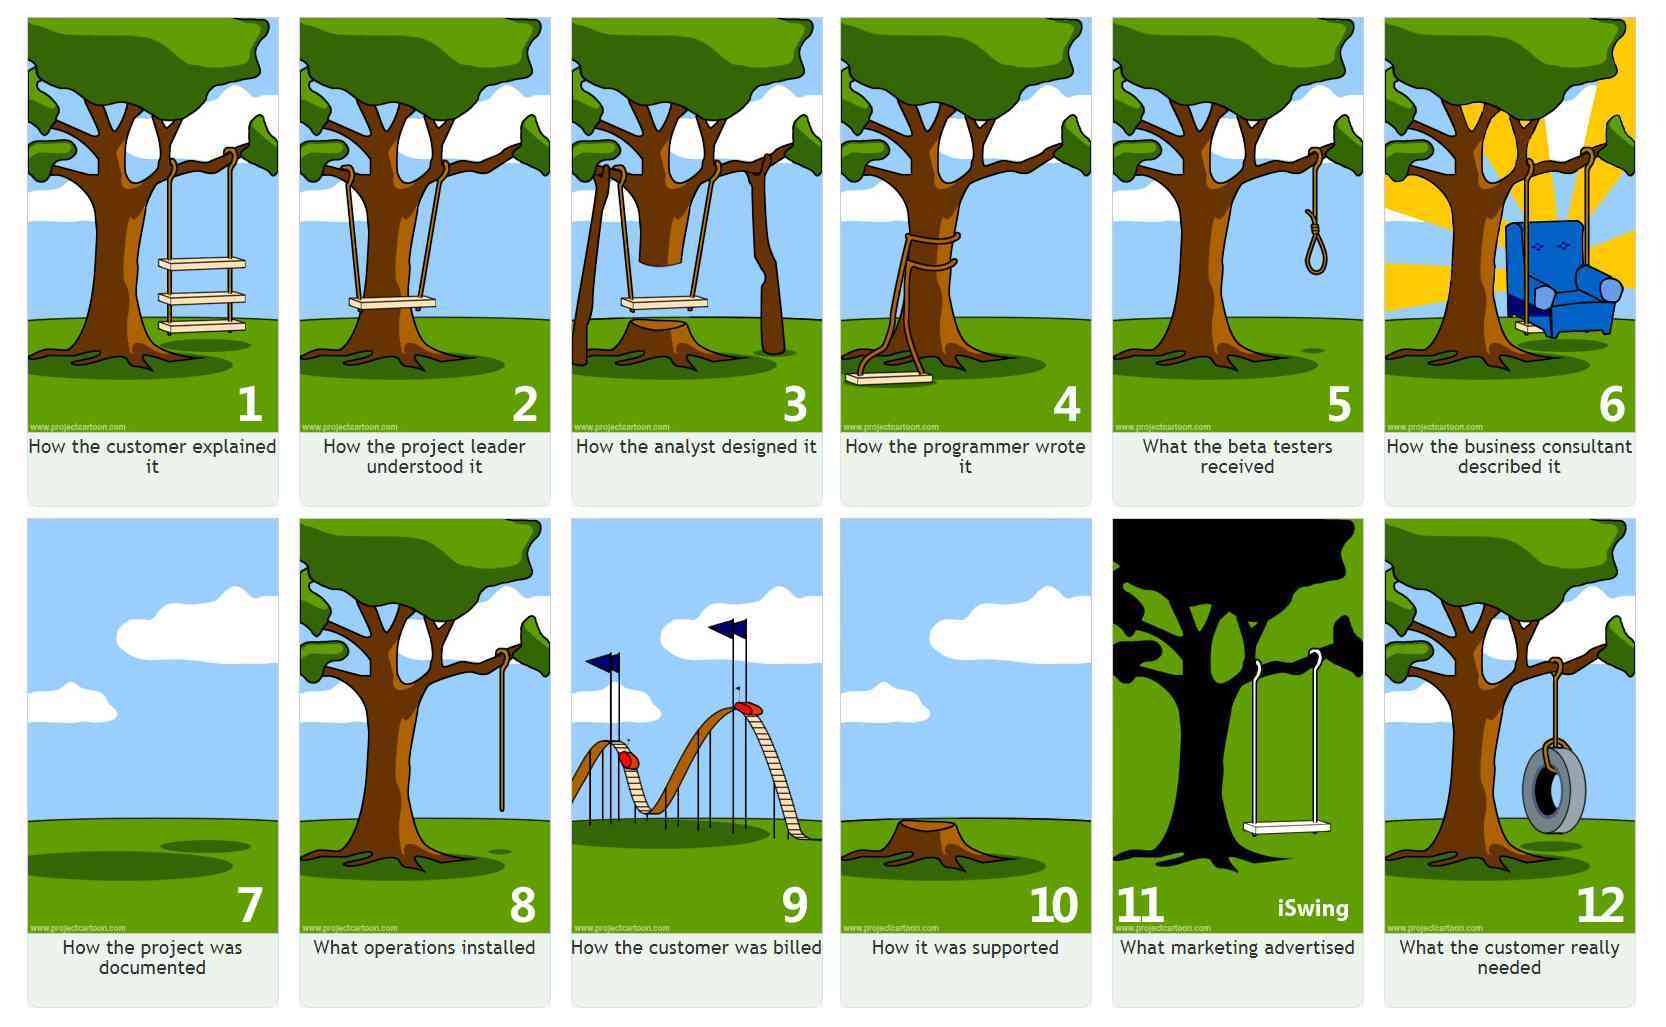
Acme wasn't building what customers needed. How had this happened? Each team interpreted things differently; each with a slight bias based on their functional area. They were never fully aligned. Even worse, they didn't understand what their customers needed to move their own businesses forward. They just built what they thought customers wanted. This is the essence of the tree swing problem.
The working group shared their revelation about optimizing for the wrong thing within R&D and suggested reviewing how success was being measured across the company. Each department pulled up their objectives and key results. Nearly all of them were aimed at each department seeking local maximum. Sales had their quotas to meet. R&D had specific output targets. Customer support was focused on triaging and closing tickets as quickly as possible. The company had grown rapidly, but that just amplified the underlying problems. The signal had been completely lost in the noise.
As the systemic problems became clear, the working group presented the concept of throughput accounting and how it could help align the organization around a single measure of success. The other team members were skeptical. Nothing else was working and the worst-case scenario was already upon them. Acme finally agreed to give it a try. They spent the next several days discussing what the transition would look like and the mechanics of how it could be measured. They also tackled ways to create tighter alignment across functional areas of the company. Together, they came up with a list of core things they would implement - all to shift the focus from measuring output to measuring outcomes.
Adopt throughput accounting over cost-based accounting
The first thing they tackled was converting their traditional cost-based accounting model to the throughput accounting model. They still maintained the traditional models for public reporting, but internally, they would make decisions based upon ROI as defined in throughput accounting.
Acme's original cost-based approach for the previous quarter:
| Income Statement | Previous Period |
|---|---|
| Revenue | 68.0 |
| COGS | 6.1 |
| Net Sales | 61.9 |
| Margin | 91% |
| R&D | 27.2 |
| Marketing | 9.6 |
| Sales | 25.6 |
| G&A | 6.4 |
| Total OpEx | 68.8 |
| Net Profit | -6.9 |
| Profit Margin | -10% |
Acme's original balance sheet for the previous quarter (simplified of course):
| Balance Statement | Previous Period |
|---|---|
| Cash | 201.2 |
| Accounts Receivable | 3.1 |
| Goodwill (Product/Intangibles Last 2 Qs) | 52.4 (25.2 + 27.2) |
| Total Assets | 284.7 |
| Current Liabilities | 16.9 |
| Long Term Liabilities | 21.5 |
| Total Liabilities | 38.4 |
| Retained Earnings | -6.9 |
| Shareholder's Equity | 253.2 |
| Total Liabilities & Equity | 284.7 |
The working group explained how this approach artificially rewarded the company by converting expenses in R&D to an intangible goodwill asset. There is no feedback on how that asset generates and captures value -- throughput. It also came to light that the financial team was deferring certain R&D expenses as a way to bolster performance on the income statement in the short term. They had planned to realize the expenses when Acme hit the inflection point as a tax mitigation strategy, but that never happened.
Once they were finished converting their financials to throughput accounting, they were overwhelmed by the reality of their situation.
| TA | Previous Period |
|---|---|
| Revenue | 68.0 |
| Total Variable Costs (COCA) | 13.6 |
| Throughput | 54.4 |
| Efficiency | 80% |
| R&D | 34.2 |
| Marketing | 2.1 |
| Sales | 25.6 |
| G&A | 6.4 |
| Total OpEx | 68.3 |
| Profit | -13.8 |
| Inventory: Goodwill (previous quarter R&D) | 25.2 |
| Inventory: 6 Months of Requirements | 120,868 |
| Total Inventory | 120,893.2 |
| Return On Investment | -.01% = (-13.8/120,893.2) |
Since thoughput accounting (TA) defines inventory as completed and uncompleted assets within the Value Exchange System, Acme's ROI was tanked by all of the work waiting to be completed. The powerful thing that this helped Acme understand was that creating more inventory drains the overall return on investment. It also learned that by treating some of the variable costs related to COCA as an operating expense, they missed critical opportunities for increasing the efficiency of marketing operations.
Looking at the financials through this perspective, Acme struggled to determine where to focus their efforts. The ongoing conversation about this exposed another critical flaw in how Acme had been approaching the Value Exchange System. Due to the speed at which they had scaled, 60,000+ work items piled up in their backlog. They struggled to understand their potential impact and effectively map them to customer and business outcomes. A product manager shared how they used they had successfully used the RICE model when they were smaller, but it had become highly inaccurate at scale given the quality of the input data and variability across product teams. She continued to explain that often, the loudest voice in the room would ultimately influence when things were worked on. In listening to her describe the flow of information between sales, customer support, and R&D, it was clear that everyone was working hard, but with such a high volume of communications, it was nearly impossible to take into account all the variables across the disparate contexts when prioritizing the roadmap.
A data scientist overheard the group talking about their challenges and interjected with a suggestion -- Acme was already using machine learning and advanced statistics in their products. Why not use the same approach to optimizing their own Value Exchange System?
The first iteration towards intelligent decision support
The data scientist explained that by using pre-existing data from sources across their toolchain, it was possible to build a decision support framework using natural language processing (NLP) to extract topics and sentiment from text-based data across all of the core tools that Acme used to sell, deliver, and support their products. Teams would not have to adopt new tools or processes, and there would be no disruption to existing business functions. Everyone put their heads together and came up with the scope for the first MVC of their intelligent decision support framework.
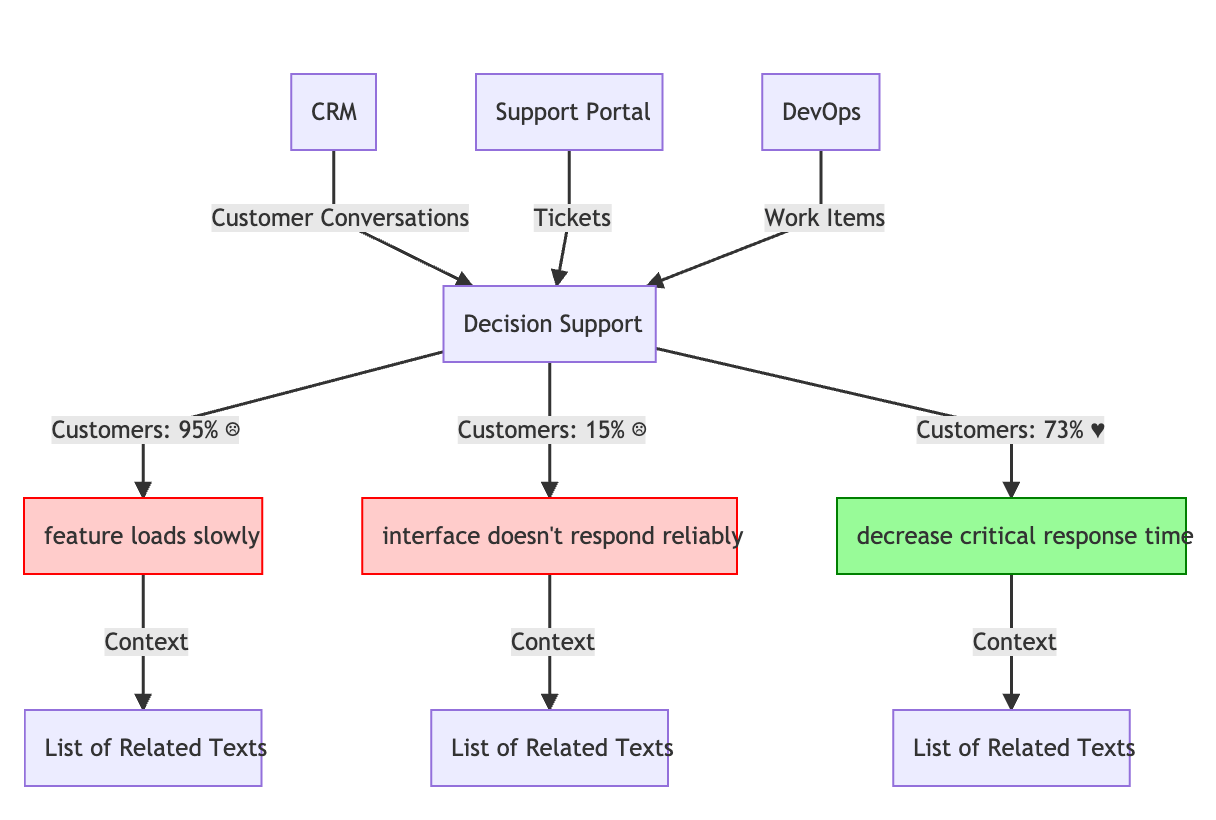
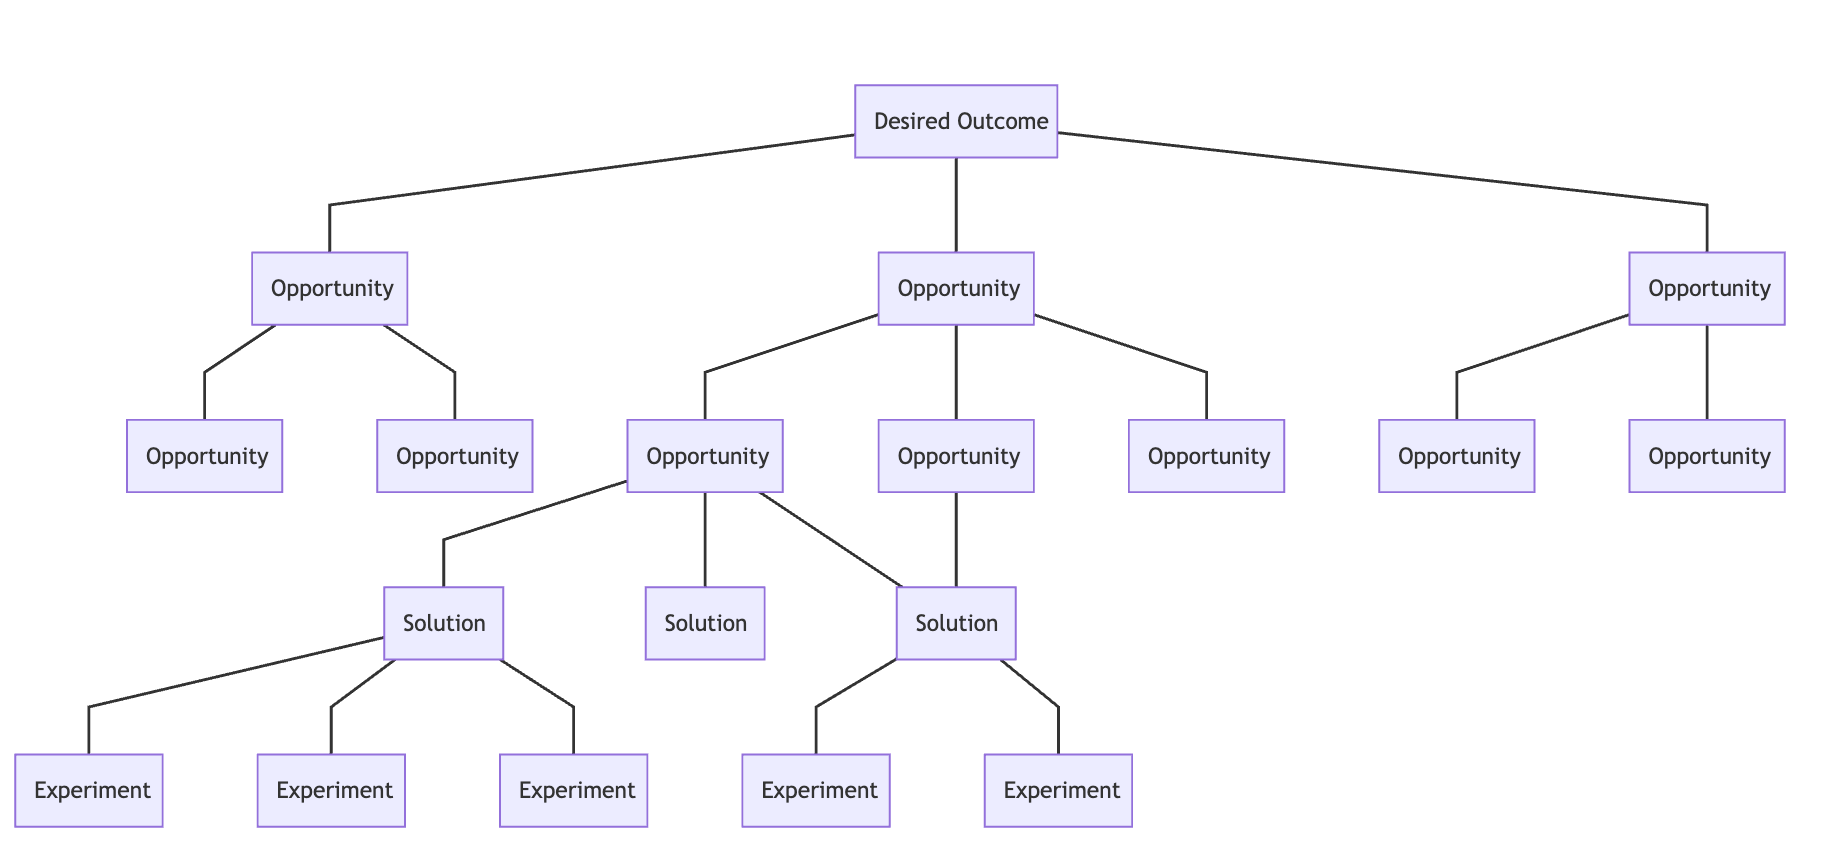
Once they achieved this level of visibility, they used the topics to create alignment across teams. Additionally, instead of continuing forward using traditional project-based Gannt charts for communicating progress on timelines and deliverables, they adopted an Opportunity Tree map that better reflected the relationship between business outcomes and solving customer needs. Based on the number of customers and the sentiment of a given topic, Acme prioritized where to focus their efforts to yield the biggest impact. Looking through all of a topic's related texts across their various communication channels within a single interface, they were able to more efficiently and effectively synthesize opportunities and connected them to outcomes.
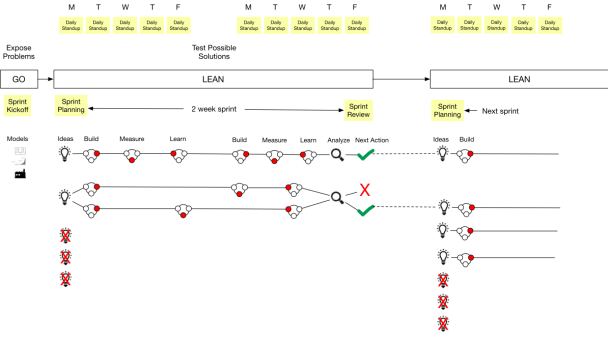
To ensure they were building what the customers needed and that the solutions captured the opportunity, they started using a continuous innovation framework to systemically validate their assumptions and solutions through lean sprints. This did not require the introduction of a new tool, but rather a change in mindset and process among the teams.
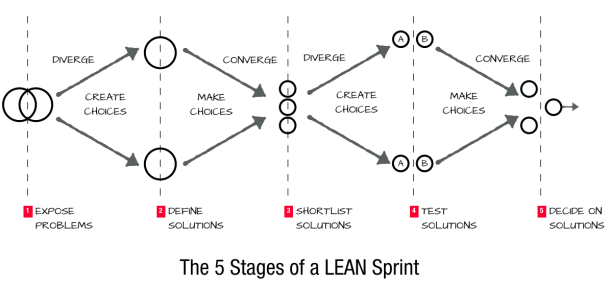
Each sprint established a target condition, hypothesis, experiment, and measurable outcome to validate or invalidate the hypothesis. This new mental model and approach to lean product development helped Acme reduce risk and establish a repeatable cadence that accomplished the following:
- Goal — Break a big vision into smaller time-boxed goals.
- Orient — Align the team around problems versus solutions.
- Leverage — Source/rank a wide diversity of possible solutions or strategies for achieving the goal.
- Experiment — Test these strategies additively using experiments.
- Analyze — Reevaluate learning against the goal.
- Next Action — Decide what’s next.
It wasn't just product teams that adopted this process -- marketing, sales, and customer support all learned how to leverage this process to drive throughput. Before any initiative was funded, the team had to justify the effort by stating a quantifiable hypothesis that explained how it would increase throughput (T), decrease inventory (I), or reduce operating expenses (OE). By being disciplined, lean, manually improving processes, and having a rudimentary decision support framework powered by their existing data, they started to see enormous gains in their throughput. Acme was just starting to scratch the surface of the possibilities for optimizing their Value Exchange System.
The Importance Of A Timely Decision Support Framework
“You can make a system work better with surprising ease if you can give it more timely, more accurate, more complete information” -- Thinking In Systems
Acme continued to invest in enhancing their intelligent decision support tool. Their ultimate goal was to model a new value stream that incorporated both the value delivery system and the value capture system. In their next iteration, they added new dimensions and types of features that were extracted from their various operational systems. They also connected their behavior analytics collection service to more effectively map how customer behavior drove specific outcomes and experiments.
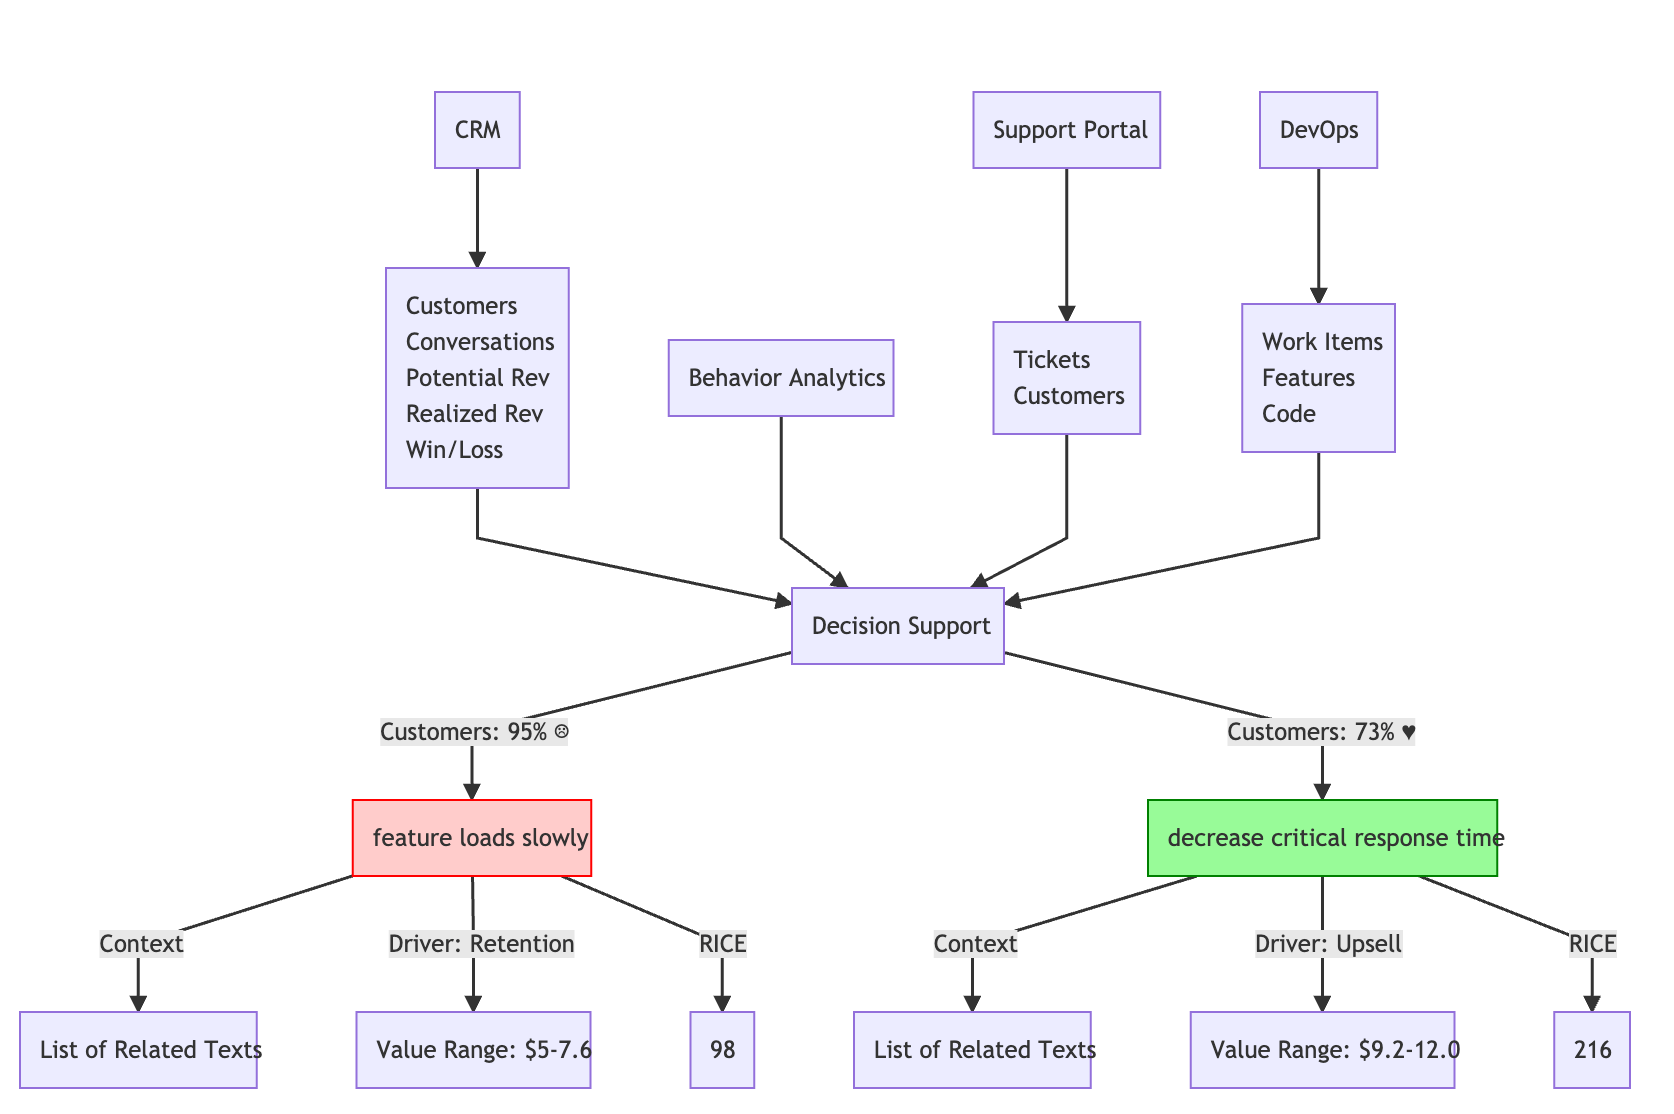
By pulling in financial data from their CRM, they derived the potential value for every single opportunity and how each mapped to the key business drivers in the Value Exchange System -- acquisition, activation, adoption, up-sell, and retention. Additionally, they automatically calculated the RICE score across all work items in a consistent manner. As a result, they removed over 99% of their inventory that did not map to valuable opportunities and adopted a "just in time" approach for requirements definition, drastically reducing inventory and improving ROI.
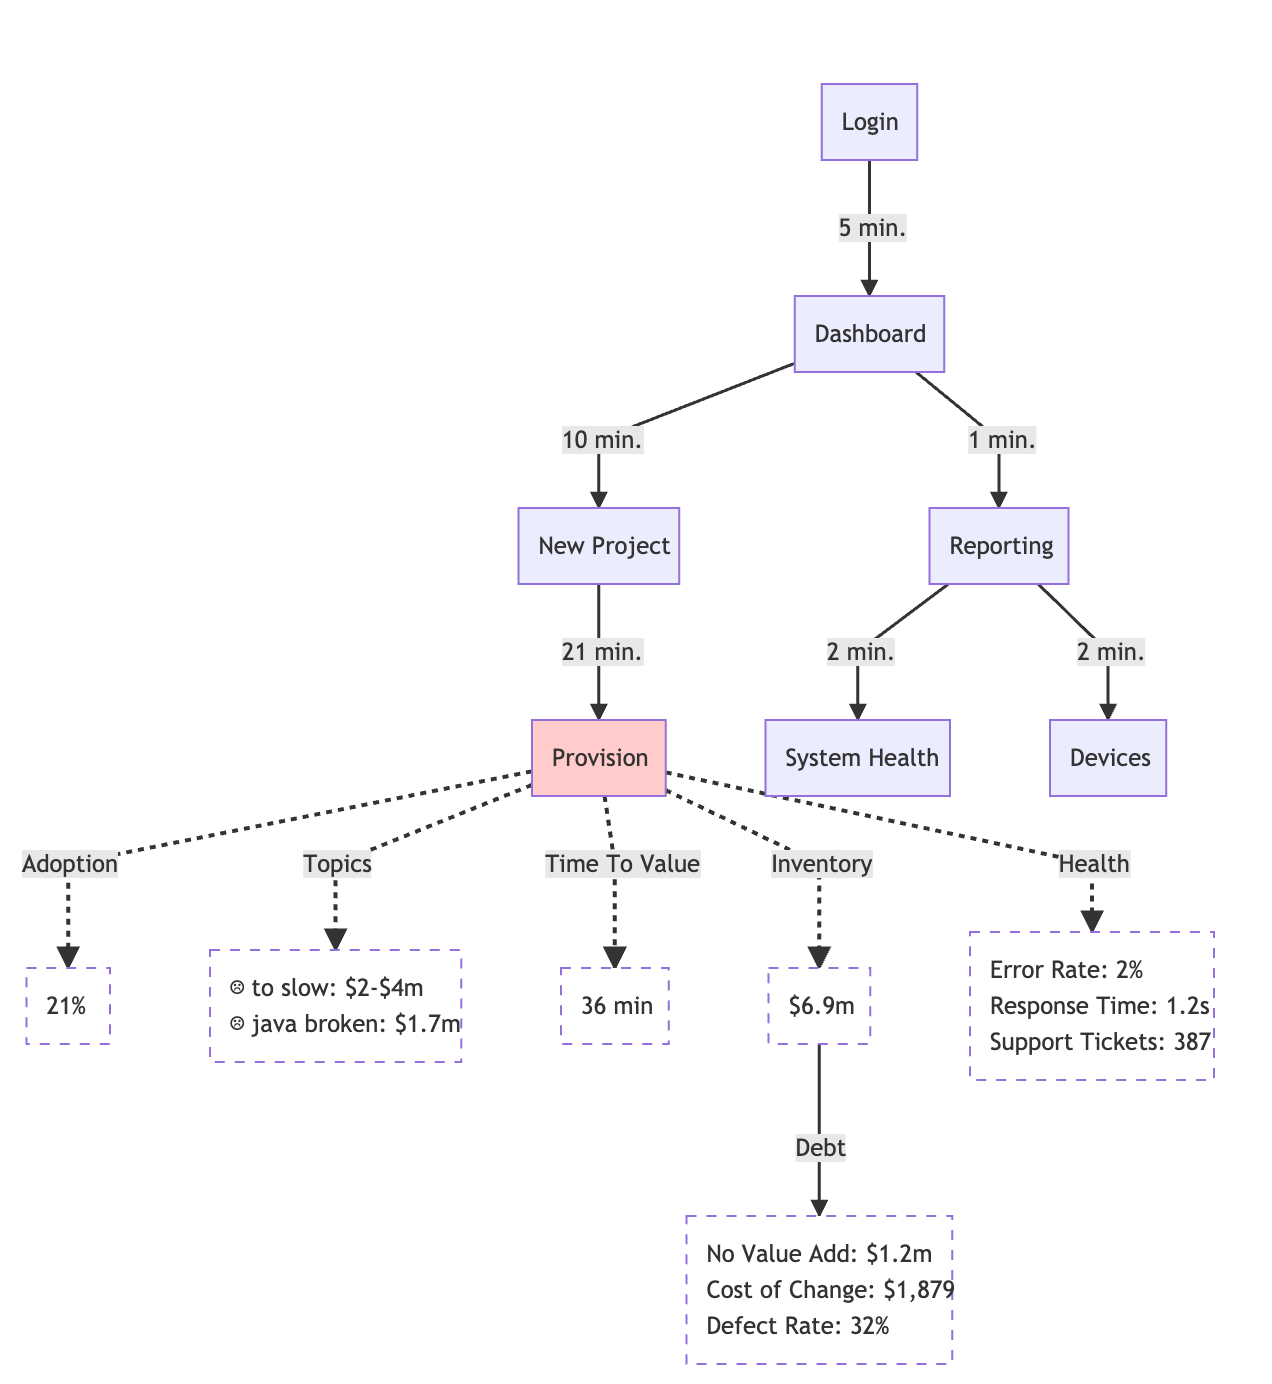
Acme went a step further and augmented its Opportunity Tree used for strategic planning with a dynamic value stream map to report on the health of the Value Exchange System. Since the software code and features were integrated into the decision support framework, they consolidated all of their analytics, logging, tracing, and reporting tools that required complex queries to surface meaningful insights with a simple visual diagram of the critical paths customers took through their product. This effectively tied the Opportunity Tree to their actual product in a way that was easy for anyone at Acme to understand. It also surfaced low hanging fruit that enabled Acme to increase the value capture rate of the assets they already had.
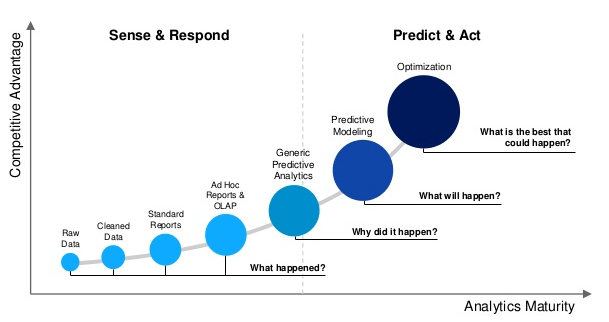
To put their journey succinctly -- Acme transitioned from sensing and responding to predicting and acting. They did not become sales-led, engineering-centric, or product-first. They became throughput driven. They still have a long way to go before becoming ROI positive due to the inefficiencies of the past, but the progress thus far indicates an upward trajectory. Because of their successful transition to profitability, the board pushed Acme to continue scaling R&D and operating expenses. The CEO politely declined; showing the board their intelligent decision support tool that highlighted hundreds of millions of dollars in potential revenue just by improving what was already there. He explained that more people won't solve the problem or help them go faster. Better decisions will.
The biggest challenge they face moving forward is staying disciplined and not falling into old habits -- something most companies are notorious for doing. It's one of the primary reasons why there are very few truly great companies out there today. Luckily, the investment in making better decisions through shorter, more effective feedback loops will let them know the day that starts happening.
**Acme's Final Set of Reported Financials**
| TA | Without Decision Support | Starting The Journey | Fully Integrated |
|---|---|---|---|
| Revenue | 68.0 | 88.4 | 138.8 |
| Total Variable Costs (COCA) | 13.6 | 11.2 | 7.6 |
| Throughput | 54.4 | 77.2 | 131.2 |
| Efficiency | 80% | 87% | 95% |
| R&D | 34.2 | 37.1 | 40.5 |
| Marketing | 2.1 | 3.2 | 4.5 |
| Sales | 25.6 | 28.6 | 31.9 |
| G&A | 6.4 | 8.0 | 9.5 |
| Total OpEx | 68.3 | 76.9 | 86.4 |
| Profit | -13.8 | 0.3 | 44.8 |
| Inventory: Goodwill | 25.3 | 59.5 | 96.6 |
| Inventory: Requirements | 120,868 | 117,567 | 1,176.2 |
| Total Inventory | 120,893.3 | 117,626.5 | 1,272.8 |
| Return On Investment | 0% | 0.0% | 3.5% |
Ending On A Personal Note
“Remember that hierarchies exist to serve the bottom layers, not the top. Don’t maximize parts of the systems or subsystems while ignoring the whole. Aim to enhance total system properties, such as growth, stability, diversity, resilience, and sustainability - whether they are easily measured or not.” -- Thinking In Systems
I acknowledge Acme's story and financials were maybe extreme and, at times, overly exaggerated. I did so to help illustrate the main themes that nearly every company I've been a part of has struggled with to varying degrees. Ultimately, the longer we continue to rely on a Value Exchange operating structure and toolchain that consists of dozens of siloed point solutions and people organizations, the longer we will be fixated on the local optimization of its parts. We need to shift our focus towards achieving the global maximum of the Value Exchange System. This will be an ongoing challenge for nearly every company as tranditional organizational theory is over 250 years old and was designed to replicate factories and machines, not dynamic systems and subsystems that are constantly evolving and changing.
As we wrap up, you might be thinking the intelligent decision support tool I described is far fetched and a pipe dream. Topic extraction, cluster analysis, sentiment analysis, Bayesian inference, and NLP does not rely on Strong AI or necessarily adopting a whole new suite of tools. It is all achievable by a capable team of data scientists and engineers using currently available open-source packages, ML libraries, and advanced statistics leveraging data most companies already have on hand. As DevOps continues to take hold and organizations shift from a project to product mindset, it's just a matter of time until someone capitalizes on the tremendous opportunity there is in optimizing the feedback loops from sales, marketing, product, engineering, UX, and customer support at scale.
When I first started at GitLab, I thought the idea of building a single application for the entire DevOps lifecycle was insane and nearly unachievable. That challenge is part of what drew me to the company. Now that I have more perspective, I'm starting to realize that maybe we've been thinking too small. Anyone up for some dogfooding?
All posts in the series:
- Part 1: A Gentle(ish) Introduction
- Part 2: Reduce Waste To Increase Flow
- Part 3: The Compounding Value Of Shorter Feedback Loops
Giving credit where it is due: The Lean Sprint and Continuous Innovation Framework were developed by Ash Maurya, founder of LeanStack.
Cover photo by Ryan Hafey on Unsplash


