Published on: May 11, 2021
7 min read
Can DevOps and project management co-exist? Yes, on the daily at GitLab
Stay agile by using GitLab for DevOps project management

GitLab is best known as an all-in-one DevOps platform, but it is also an effective tool for project management. Non-technical teams at GitLab, such as the Marketing team, use the GitLab DevOps platform for project management, and recently the Alliances team learned that DevOps and project management work well for our purposes.
About the IBM partnership
GitLab recently launched a partnership with IBM to help the organization automate their DevOps platform. Since I work on the Alliances team, I needed an efficient, compatible, and high-performance project management application to manage the many moving parts of the GitLab and IBM partnership as well as other projects related to our partnerships.
My very first instinct was to test a few of the project management web applications on the market, but this would involve a tedious process of convincing my colleagues to join me on this journey to explore a sprawling new set of tools. Then I thought why not explore our own Gitlab DevOps platform as a project management tool? The beauty of GitLab is that it is a DevOps platform delivered as a single easy-to-use application.
Some of my early questions were:
- Can the GitLab DevOps platform work as a project management tool for the strategic Alliance team?
- Can GitLab manage and track business activities over a period of time?
- Can team members collaborate and manage various projects using a single application?
In the end, the journey to adopting GitLab as a DevOps platform and project management tool was similar to the journey many of our customers experience. In this blog post, I will dive deeper into how the Alliance team uses GitLab for project management, explain how we used GitLab to onboard a new strategic partner, and launched support of GitLab Ultimate for IBM Cloud Paks. All the pre- and post-onboarding activities in particular required collaboration and contributions from various teams across the organization.
Applying DevOps features to project management
About epics and roadmaps
Why organize work into a hierarchy? I began the strategic partnership effort by organizing the work into multi-level epics. The idea behind epics is to aggregate similar work (or issues) into epics and manage delivery of work. In the example below, you'll see the top-level epic was called "IBM cloud paks" which contained three child epics.
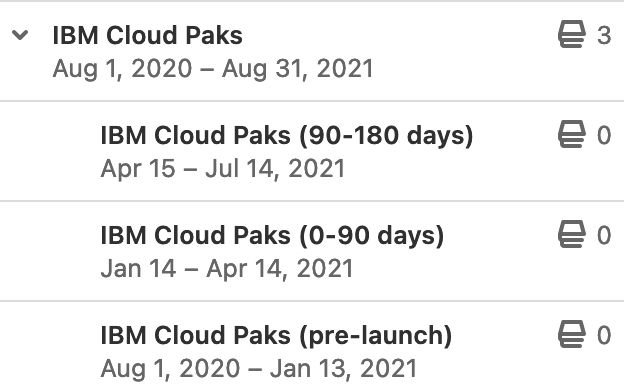 Work is divided into three time-bound levels for the IBM cloud paks project: Pre-launch, 0-90 days, and 90-180 days.
Another way to represent the epics is through a roadmap view. The main advantage of this feature is that it allows the collaborators on epics and issues to monitor project progress using a calendar timeline view.
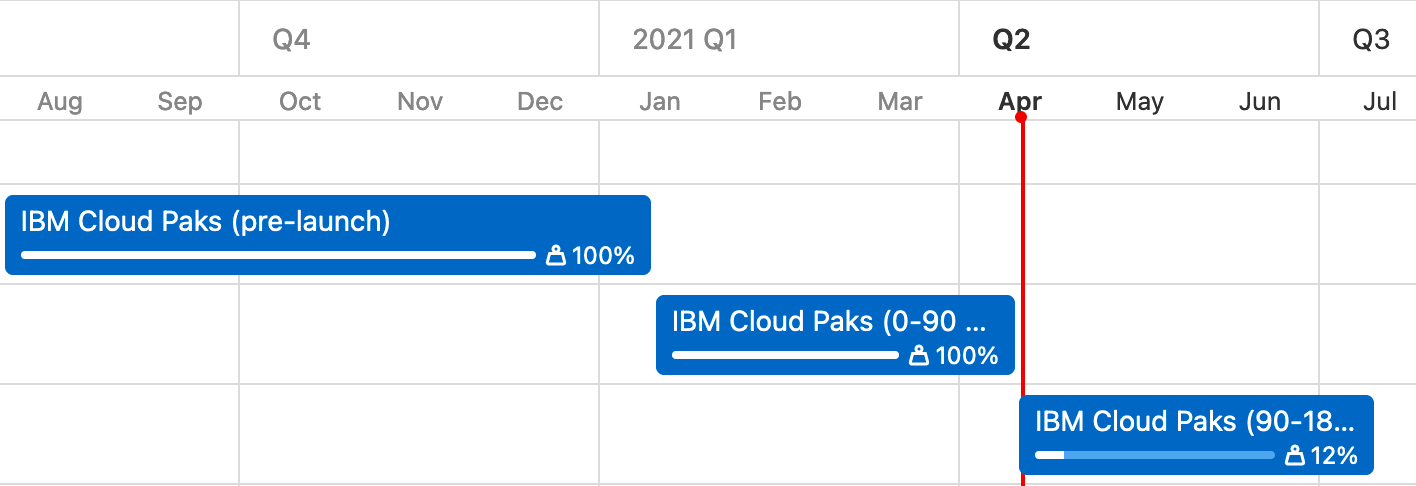 The same IBM cloud paks project epic is depicted using the Roadmap view, which adopts a timeline view.
How issues are used to capture work
Click into any of the epics to find a set of issues that make up the epic. I use issues as the basic unit of work. Contained within the "IBM cloud paks: Pre-launch" epic are 33 issues.
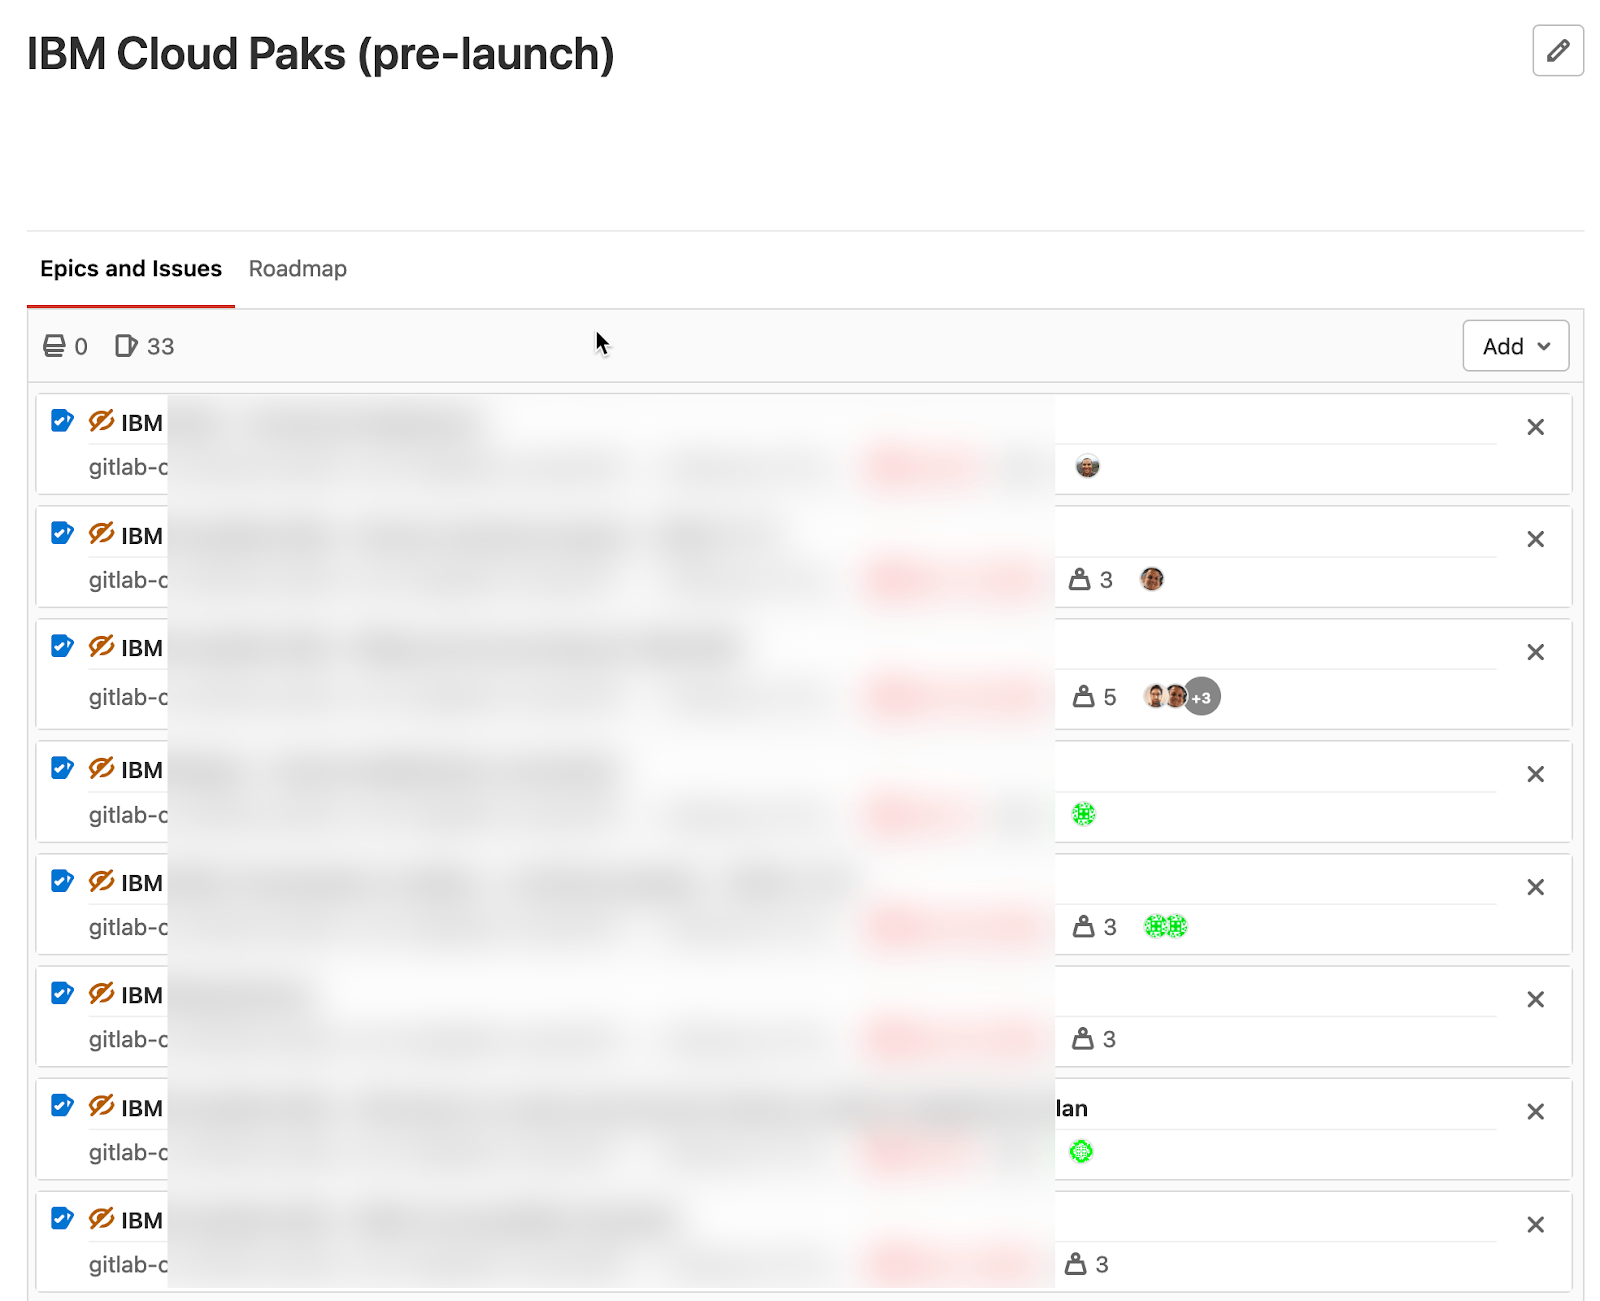 Inside the "IBM cloud paks: Pre-launch" epic are 33 issues
One thing to note is that an issue can have a single assignee or owner, or it can have multiple assignees.
How to use issue boards
An agile board can help a user visualize work and manage all the open threads in a given epic and/or project. The board can help you move issues efficiently through various phases of work. On the Alliances team, we are always iterating on how to better track the status of issues. Here is more information about the current status flows for the Alliances team.
The screenshot below shows how an issue board can be applied as a Kanban board by filtering for the "IBM" label. To see transitions between work stages, use scoped labels, which are mutually exclusive and represent transitions between various workflow statuses, such as "status::1" and "status::2"
 How we use boards for the IBM cloud paks project.
Milestones help time-box events
While an epic is a collection of related issues, merge requests, and sub-epics and is generally used to scope a long-running initiative or program (e.g., a marketing campaign or a new product category) epics can also contain smaller, more discrete and timeboxed events, such as monthly releases or calendar quarters. These timeboxes are represented as Milestones, which roll up issues and merge requests in the same way as higher-level epics. Apply the "Milestone view" to track progress on the smaller deliverables within an epic.
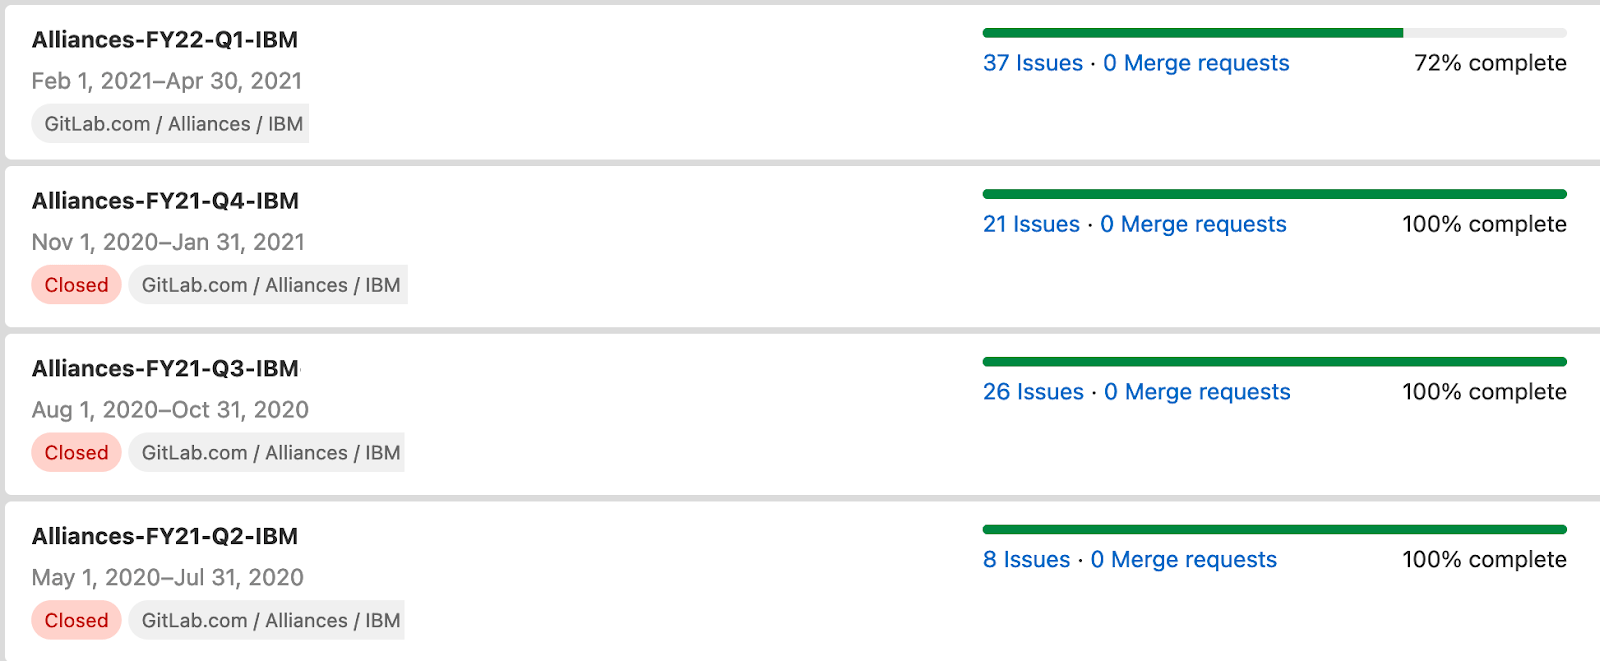 How milestones can be used to track work progress within a specific time frame.
How Milestone burnup and burndown charts chart progress
Burnup and burndown charts are used by project managers to measure progress. Burndown charts analyze how much work is left in a project before it can be finished successfully. Burnup charts measure the work that has been done against the total work for the project. Both types of charts are available in the GitLab DevOps platform. I relied mostly on epics and milestones to track work progress for the IBM partnership.
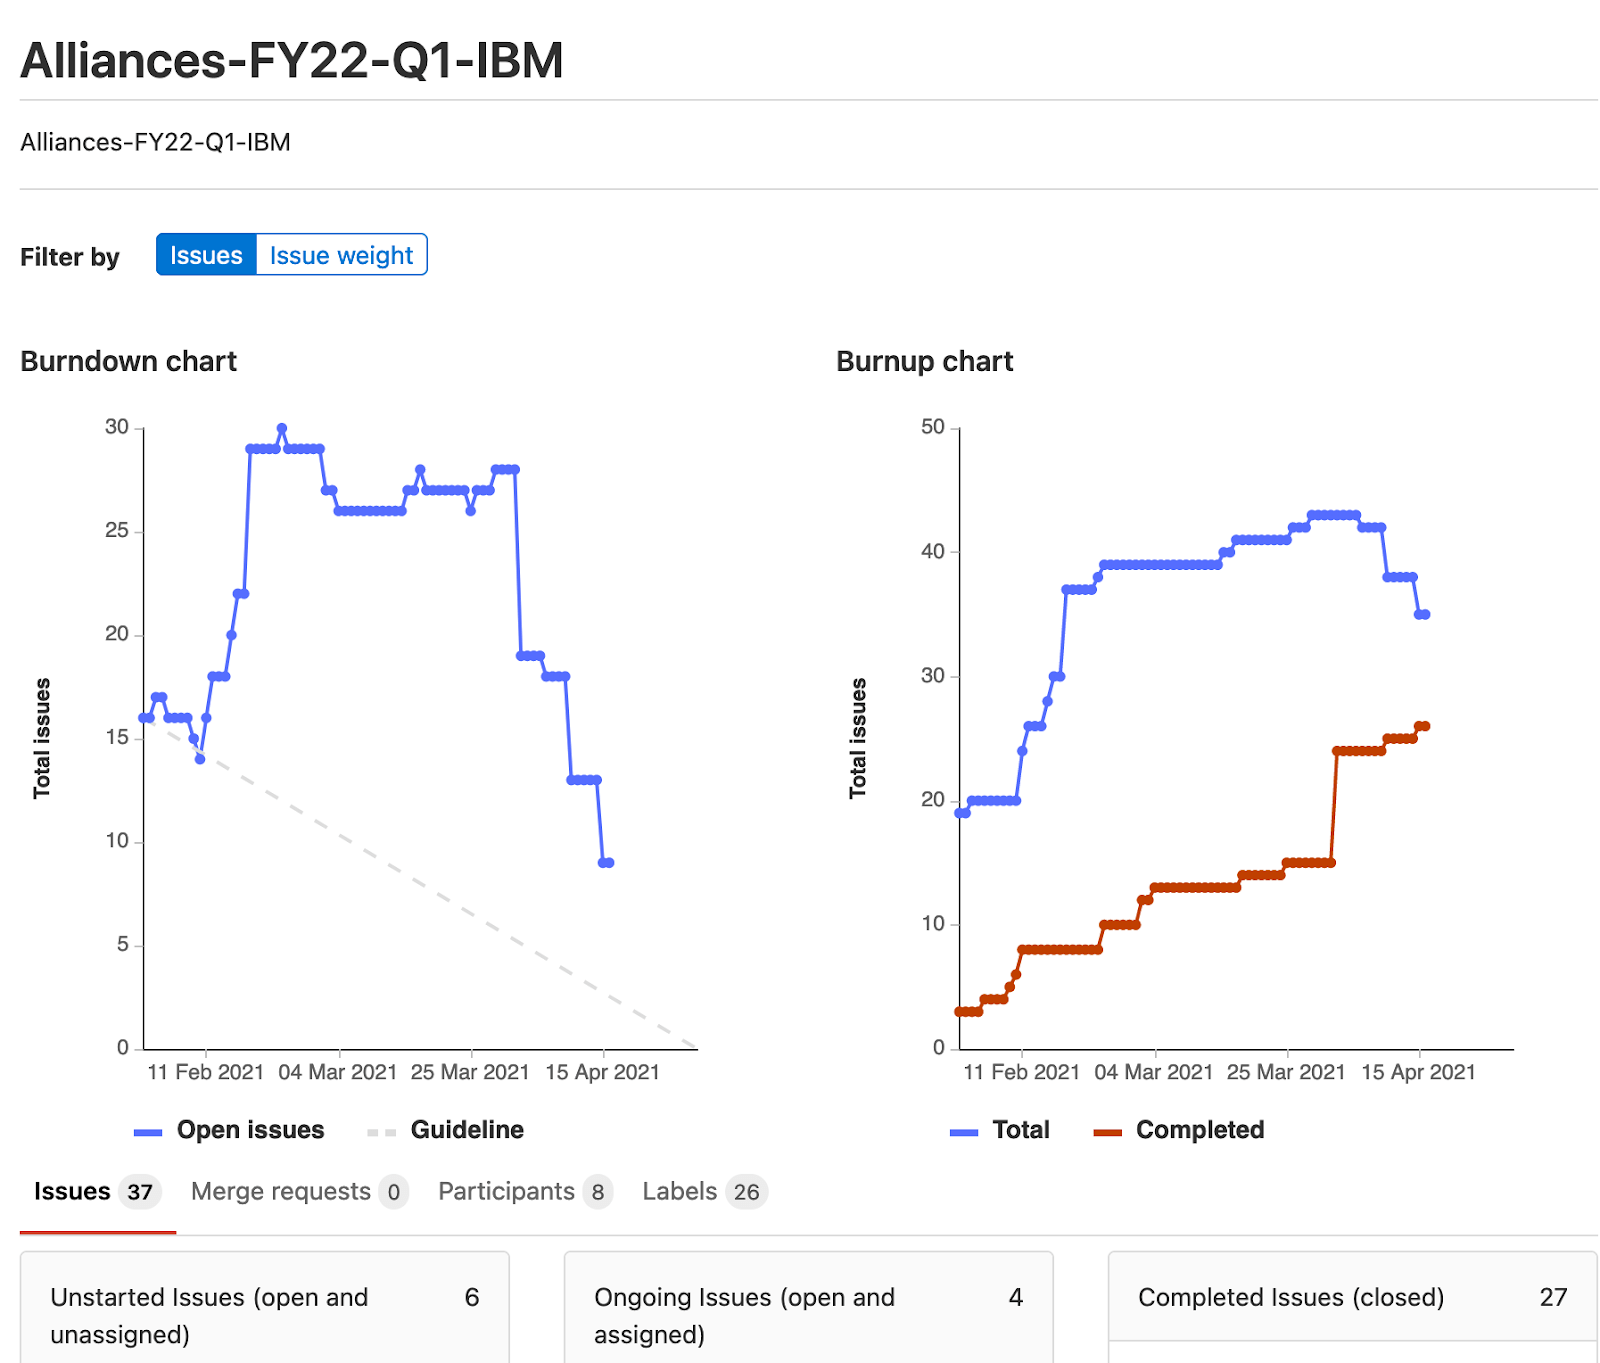 The burdown and burnup charts for the IBM cloud paks partnership project.
Inside analytics and insights project management tools
Most project management tools are great at capturing project details, and can help answer questions such as "where does the project stand on actual vs. planned activities?" or can help track progress using milestones and due dates. Project analytics and insights dashboards are built into the GitLab DevOps platform. There are many built-in analytics dashboards, such as CI/CD, code review, merge requests, and issues. For the IBM partnership project, I used the issues dashboard analytics to see how many issues were opened compared to how many issues were closed. This tool helped me manage the team capacity and identify any bottlenecks in the project.
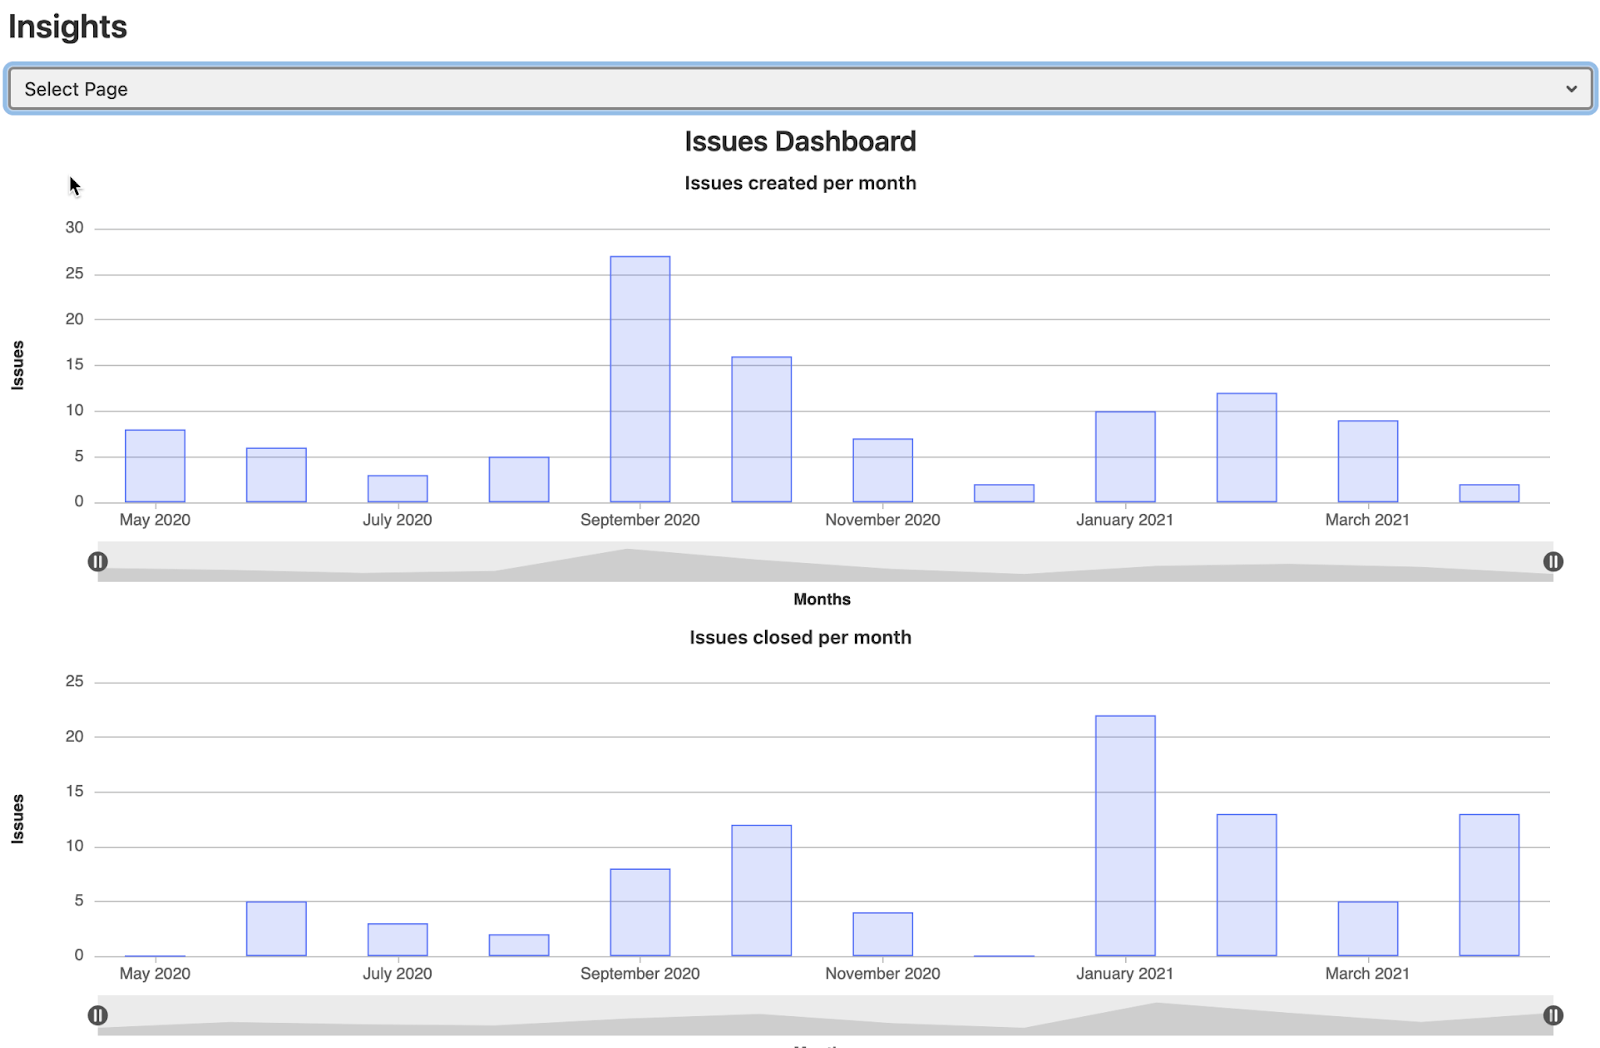 The insights dashboard shows many issues were opened vs. how many issues were closed each month.
Value Stream Analytics is a particularly unique feature of GitLab's analytics suite. Since GitLab is a complete DevOps platform with a single data store, GitLab can automatically generate reports to not only identify high-level metrics and blockers, but also drill down into those blockers and improve value flow with just a few clicks.
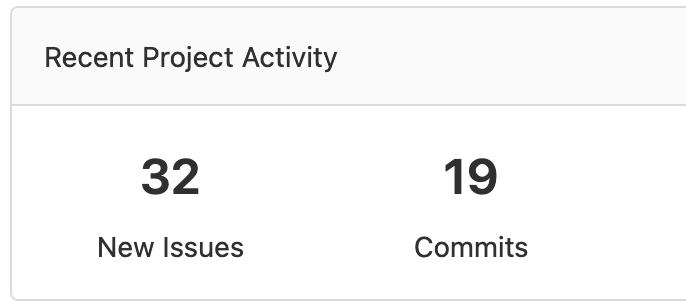 Analytics showing recent project activity.
The Value Stream Analytics provides a high-level view into common stages of the SDLC out-of-the-box, making it easier to monitor the overall workflow from discussion to code changes, through review and collaboration, and out to production – with no additional work required. And since the code changes and collaboration are happening within GitLab, just one click on an item will take you to the blocked issue or merge request, so you can comment, reassign, or contribute to move things along.
Since all the necessary data is already in GitLab's system, customizing Value Stream Analytics can be completed in just a few clicks: Hiding and reordering stages and even creating your own with simple drop-down menus.
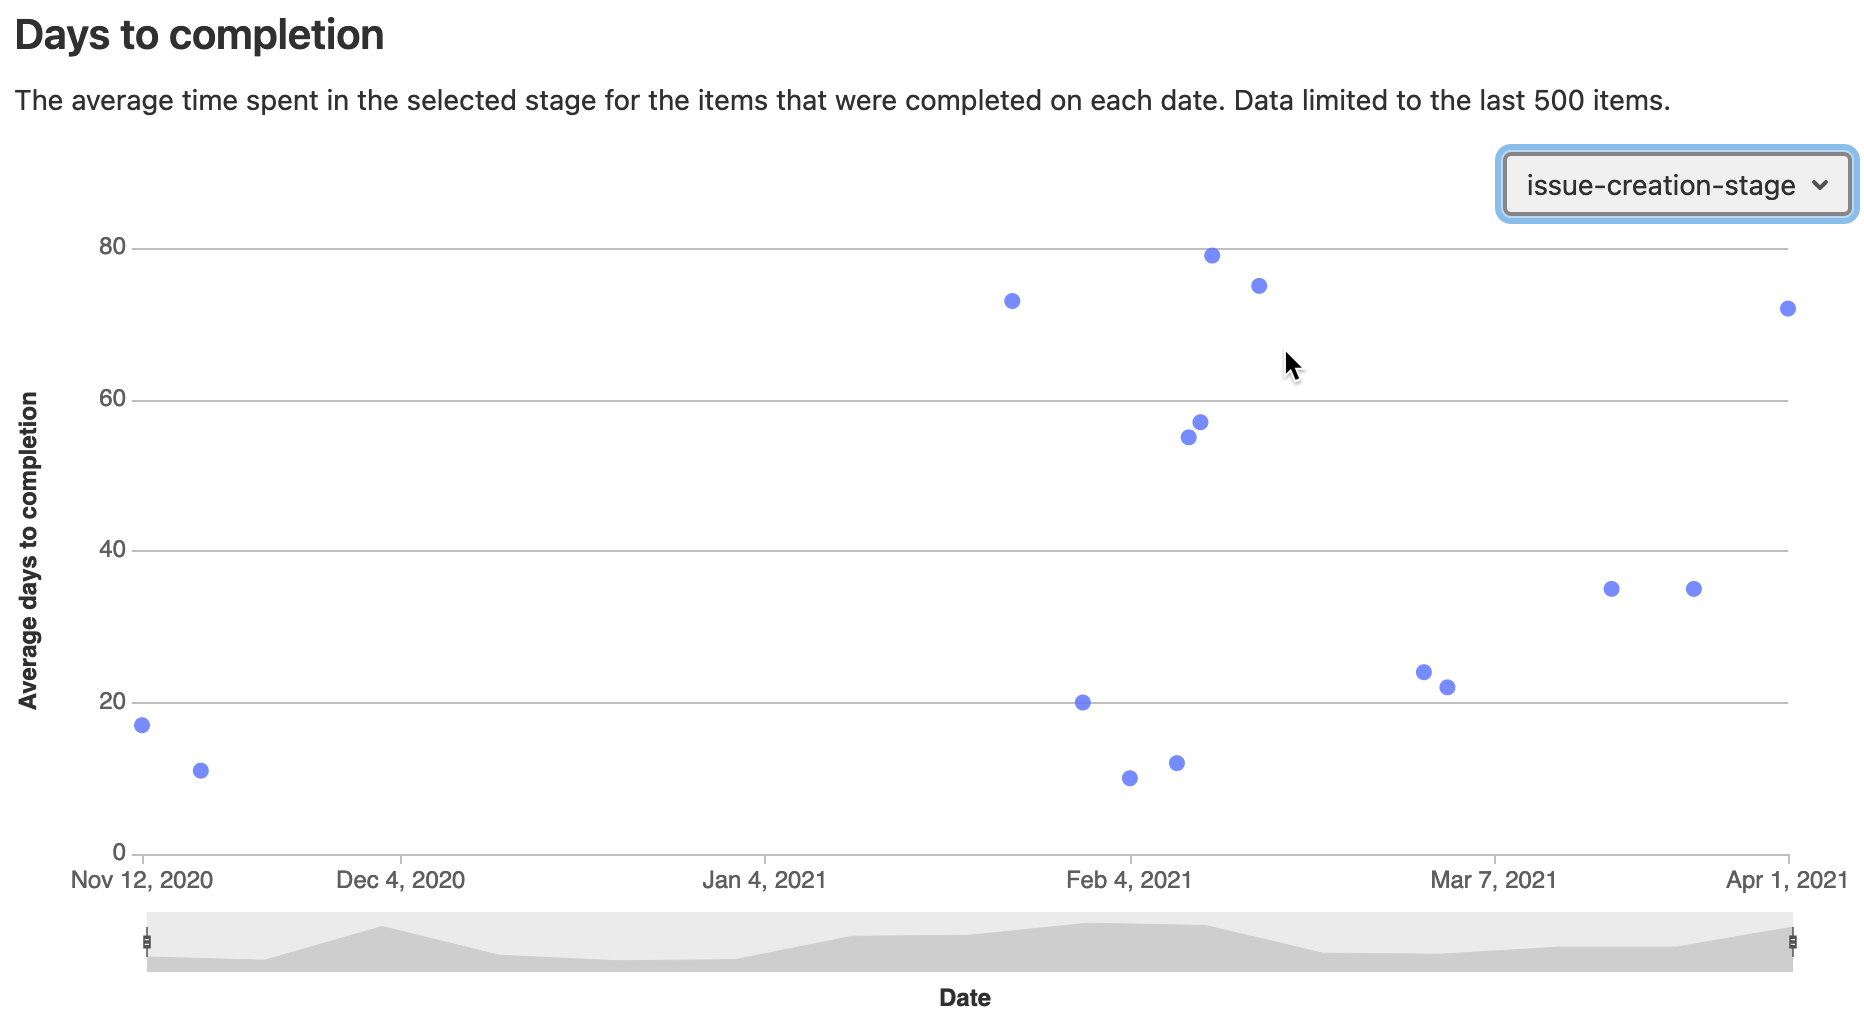 The custom value stream above shows the number of days to completion.
DevOps platform and project management in one
There are many project management tools in the marketplace and solutions for managing the SDLC of a project. The GitLab DevOps platform and project management tool satisfied my need to track partnership-related activities while also managing the technical demos and workshops developed for the IBM partnership. I look forward to continuing to explore the constantly-evolving GitLab platform to grow and manage our strategic partnerships on the Alliances team.
Cover image by Martin Sanchez on Unsplash
We want to hear from you
Enjoyed reading this blog post or have questions or feedback? Share your thoughts by creating a new topic in the GitLab community forum.
Share your feedback
