Published on: April 30, 2026
12 min read
Build an automated detection testing framework with GitLab CI/CD and Duo
Learn how GitLab's Signals Engineering team built the WATCH framework to continuously validate our security monitoring pipeline.

When it comes to managing a healthy alerting system for your security operations center (SOC), tuning false positives is only half the battle. An often overlooked aspect of a healthy alerting system is making sure that critical detections which rarely fire haven’t simply broken completely without anybody noticing.
At GitLab, the Signals Engineering team tests detections by simulating real malicious behavior on infrastructure we own to validate that our detections fire end-to-end — from the log source, through ingestion, into the SIEM, and all the way through our security orchestration, automation, and response (SOAR) alert routing. This is the approach taken by commercial Breach and Attack Simulation (BAS) tools, but those tools are expensive, generic, and not tailored to our specific detection stack. So we built our own fully automated framework we named Weekly Attack Testing for Continuous Health, or WATCH.
In this article, you'll learn why we developed this framework, how it works, and how to use it in your environment.
A gap in detection validation
With log schema changes, SIEM updates, pipeline misconfigurations, etc. there are a million ways for your detections to fail silently and only one way for them to fire as expected. When faced with these odds, the conclusion is obvious: “Let’s trigger some old detections!” This raises the next question, however, of “How exactly does one trigger detections?” and “How often?”
One way to trigger detections is through the synthetic approach of reintroducing logs into your SIEM that simulate malicious behavior. Then, you wait to see if your detection rule catches the fake issue and triggers an alert. This approach, aside from failing to prove the detection works in a “real world” scenario, doesn’t validate one of the most error-prone stages of the alert lifecycle, log ingestion (i.e. from log source to SIEM).
We previously wrote about how our GitLab Universal Automated Response and Detection (GUARD) system automates detection creation and deployment through a detections as code (DaC) pipeline and how alerts are routed and triaged through our SOAR. Our DaC pipelines solve the problem of validating that a detection can deploy without errors, but it doesn't answer the question of whether that detection will actually fire when the behavior it targets occurs in the wild.
WATCH closes that gap. It's the continuous validation layer that gives us confidence that our detections are working.
How WATCH works
At a high level, WATCH works by executing scripted attack simulations in our staging environment, and then verifying that the expected alerts propagate through our entire security monitoring stack: our SIEM for detection rules, our SOAR for alert routing, and ultimately the dashboards our team uses to monitor detection health.
The lifecycle of a WATCH test looks like this:
- Scheduling: Every week, a scheduled GitLab CI/CD pipeline discovers all active tests and distributes them into randomized time slots across the week. Randomization is important; we don't want tests firing at predictable times, which would make it too easy to distinguish test activity from real threats and could mask timing-sensitive issues with our detections.
- Heads-up notification: Before a test runs, WATCH notifies our SOAR via a dedicated "WATCH Heads Up" story, registering the detections it expects to trigger. This creates trackable records so our SOAR knows what's coming.
- Execution: The test runs its simulated malicious behavior. For example, it resets an admin account password or makes suspicious API calls against the staging environment.
- Detection: The SIEM processes the activity logs from staging and (hopefully) fires the corresponding detection rules.
- Correlation: As alerts arrive in our SOAR, an "Is this a WATCH Test?" check determines whether each alert corresponds to a registered test by matching on three factors: the time window between the test run and the alert, the actor identity (IP or username), and the rule ID of the detection that fired. This is what prevents WATCH-generated alerts from being escalated as real incidents to SIRT, while still validating the full pipeline.
- Verification: A follow-up pipeline stage checks whether all expected detections fired, updates the detection status metadata, and deploys updated results to our GitLab Pages dashboard. If any detection fails to fire, a notification is sent to our team's Slack channel.
Using WATCH with GitLab CI/CD
WATCH leverages GitLab CI/CD as its orchestration backbone across three pipeline stages.
The schedule_pipelines stage runs weekly and handles test distribution. It discovers all active tests, bins them into groups, and creates scheduled pipelines set to run at random times throughout the week. Each scheduled pipeline is given a TESTS_TO_RUN variable specifying which tests it should execute.
The run_tests stage is where the actual attack simulation happens. It executes the tests assigned to that pipeline run, saves execution statistics to detection_status.json, and records SOAR record IDs so alert correlation can happen downstream.
The pages stage handles verification and reporting. It queries our SOAR to confirm that alerts were generated and properly routed, updates detection metadata with the verification results, and deploys the GitLab Pages dashboard with the latest test outcomes.
Below is a template GitLab CI/CD gitlab-ci.yml configuration file for the WATCH pipeline:
      spec:
  inputs:
    weekly_scheduling:
      type: boolean
      default: false
      description: "Enable weekly scheduling of detection tests."
    update_pages:
      type: boolean
      default: false
      description: "For triggering the update of GitLab Pages dashboard."

---

# Specify the Docker image to use for the job
image: python:3.12

stages:
  - schedule_pipelines
  - run_tests
  - pages

# Job to manage scheduled pipelines (runs when weekly_scheduling input is true)
manage_scheduled_pipelines:
  stage: schedule_pipelines
  script:
    - pip install -r requirements.txt
    - python scripts/manage_scheduled_pipelines.py
  rules:
    - if: $TESTS_TO_RUN == null && $CI_PIPELINE_SOURCE == "schedule" && [[ inputs.weekly_scheduling ]] == true
      when: on_success
    - when: never

# Job to run detection tests, save tines_record_id to detection_status.json, and commit
run_detection_tests:
  stage: run_tests
  script:
    - pip install -r requirements.txt
    - python main.py --prod --save-stats --scheduled-tests
  rules:
    - if: $TESTS_TO_RUN
      when: on_success
    - when: never

# Job to verify alerts, update detection_status.json, commit, and deploy pages
pages:
  stage: pages
  script:
    - pip install -r requirements.txt
    - python scripts/verify_and_update_detections.py --tines-api-key ${TINES_API_KEY}
    - mkdir -p public/data
    - cp detection_status.json public/data/
    - cp -r static/* public/
  pages: true  # Required for GitLab 17.9+ to trigger Pages deployment
  artifacts:
    paths:
      - public
  rules:
    - if: $TESTS_TO_RUN == null && [[ inputs.update_pages ]] == true
      when: on_success
    - when: never
How we write tests with GitLab Duo
One of the design priorities for WATCH was making it easy for anyone on the Signals Engineering or SIRT team to add new tests. The framework provides a BaseSecurityTest abstract class that handles all the boilerplate tasks — test ID generation, actor identity management, SOAR coordination — so that test authors only need to focus on three things: setting up the test environment, executing the simulated malicious behavior, and cleaning up afterward.
      class BaseSecurityTest(ABC):

    def __init__(self, config = {}, test_id: Optional[str] = None):
        self.test_id = test_id or str(uuid.uuid4())
        self.test_name = self.__class__.__name__
        self.expected_detections = {}
        self.actor_id = config.get('gitlab', {}).get(
            'default_actor_id',
            "sirt_detection_test_user_" + self.test_id[:8]
        )
        self.isActive = True
        self.test_run_time = 300
        self.config = config

    @abstractmethod
    def setup(self) -> bool:
        """Prepare test environment and resources"""

    @abstractmethod
    def execute(self) -> Dict[str, Any]:
        """Execute the malicious behavior simulation"""

    @abstractmethod
    def cleanup(self) -> bool:
        """Clean up test environment and resources"""
The key configuration is the expected_detections dictionary, which maps SIEM rule names of the detections we expect to trigger to the actor identity and expected alert arrival time. A new test is just a Python file in the tests/ directory that subclasses BaseSecurityTest, defines its simulated behavior, and declares which detections it expects to trigger. The test runner automatically discovers it on the next scheduled run.
This low-friction interface matters because detection testing only works as a practice if the team actually writes tests. If adding a test requires understanding the full pipeline internals, nobody will do it. The simple contract to implement setup, execute, and cleanup, and declare your expected detections, also makes WATCH tests a great candidate for GitLab Duo, GitLab's AI assistant. Give Duo the base class and a prompt like “Make me a test that clones lots of projects from a target group” or “Make me a test that accesses all the CI variables in this project using GraphQL,” or even “Rename all these projects to use the same naming scheme."" Duo can then scaffold a working WATCH test that plugs directly into the framework. This lowers the barrier even further: An engineer can go from "I want to test this detection" to a running test with Duo doing most of the implementation work.
Pro Tip: To make GitLab Duo even more effective, I used Duo Agent Skills, which is perfect for defining standards and procedures for routine work like writing tests. In our project directory there is a folder called skills/WATCH-test-creator with a SKILL.md outlining what a good test looks like, helper functions the test can use, and what the project is for. This file is read immediately after a prompt like the ones above are entered, which makes having to constantly remind Duo what it is you’re doing and how to do it no longer necessary. Most importantly, it makes the results consistent and higher quality! Here is a snippet of that file:
      ---
name: WATCH-test-creator
description: Create WATCH (Orchestrated Offensive Penetration Simulator) security detection tests that simulate malicious behavior on GitLab infrastructure to validate SIEM detection rules and alerting pipelines.
---

## WATCH Test Creator

You are an expert at writing security detection tests for the WATCH framework. WATCH tests simulate malicious activities on GitLab-owned infrastructure to verify that the SecOps security monitoring stack (Elastic SIEM, Tines SOAR, alerting rules) properly detects and responds to threats.

### Architecture Overview
```
Project Root
├── core/
│   ├── base_test.py          # Abstract base class all tests inherit from
│   ├── test_runner.py         # Auto-discovers and executes tests
│   └── webhook_manager.py     # Tines/SOAR notification integration
├── tests/
│   ├── gitlab/                # GitLab-specific detection tests
│   └── gcp/                   # GCP-specific detection tests
├── utils/
│   ├── gitlab_helper.py       # GitLab API wrapper (users, projects, tokens, webhooks, OAuth)
│   └── crypto_utils.py        # Password generation utility
├── config/
│   ├── settings.py            # Config loader (reads YAML + GITLAB_ADMIN_PAT env var)
│   └── environments/
│       ├── dev.yaml           # Local GDK config
│       └── prod.yaml          # Production staging.gitlab.com config
├── main.py                    # Entry point with CLI args
└── detection_status.json      # Test results and detection metadata
```
Improved visibility through test dashboards
WATCH also deploys two interactive dashboards via GitLab Pages that give the team real-time visibility into detection health.
- The Detection Status Dashboard provides an overview of all detection rules and their current test status, including metrics like how many times each detection has fired, its current pass/fail state, and how long the detection has been active. The table is filterable and sortable, so engineers can quickly identify which detections need attention.
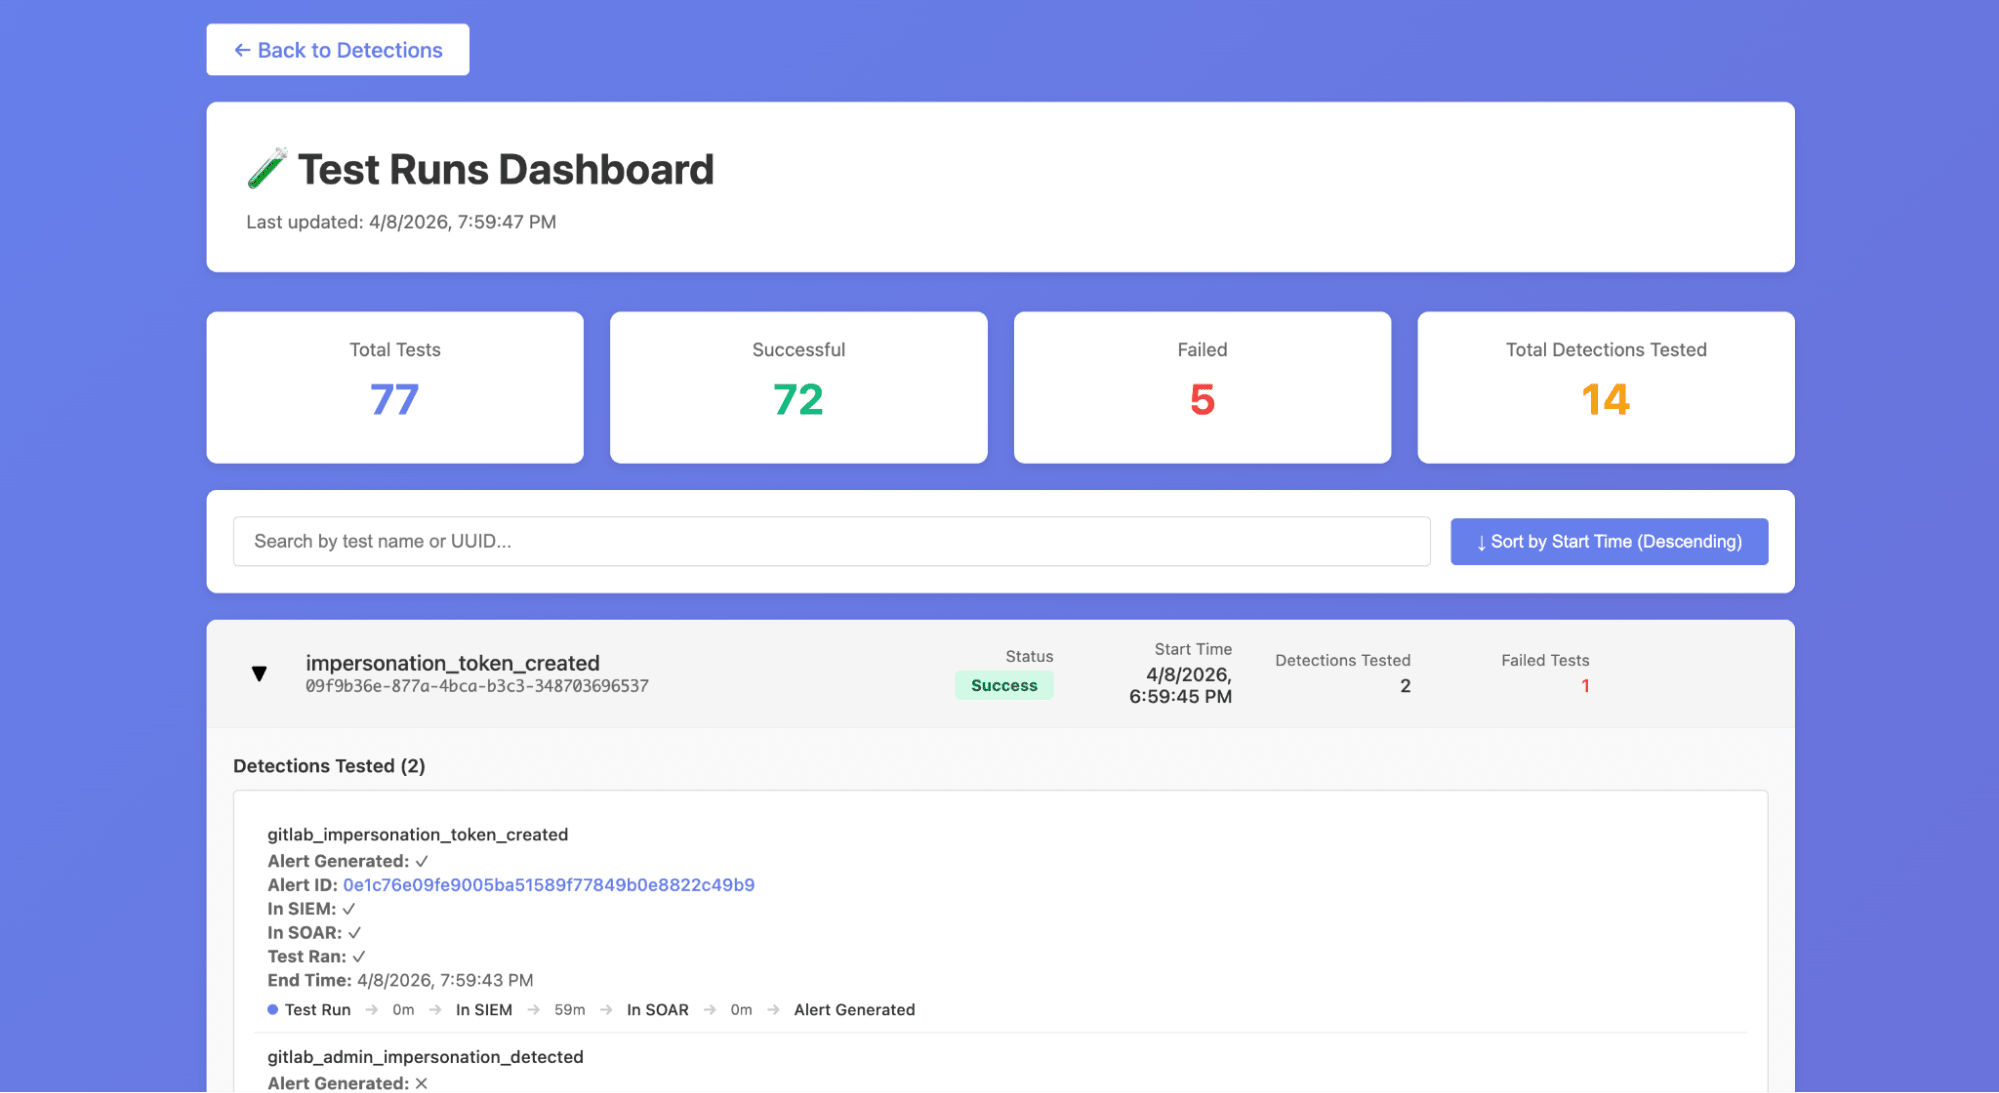
- The Test Runs Dashboard offers a detailed view of individual test executions, grouped by test ID with detection coverage breakdowns. It includes a timeline visualization showing alert propagation times to help us see how long it took from test execution to alert arrival and direct links to the corresponding alerts in our SIEM.
These dashboards replaced what was previously a manual process of digging through pipeline logs and SIEM queries to understand whether our detections were healthy.
Like the rest of GUARD, WATCH leans heavily on GitLab as its platform:
- GitLab CI/CD Pipelines and Scheduled Pipelines orchestrate the entire test lifecycle from weekly scheduling through execution and dashboard deployment.
- Pipeline inputs allow stages to be triggered independently, so we can re-run just the verification step or just the dashboard update without re-executing all tests.
- CI/CD Variables securely store the API keys needed for Tines and GitLab staging access.
- GitLab Pages hosts the WATCH dashboards with zero additional infrastructure, which means no separate hosting to manage, no extra deployment tooling.
- Because tests are just Python files in a GitLab project, they benefit from version control, merge request reviews, and code ownership the same way our detection rules do through DaC.
WATCH helps us stay proactive
Building WATCH has shifted our team's relationship with detection quality from reactive to proactive. Before WATCH, a broken detection would only surface when an incident occurred and the expected alert was missing; that’s the worst possible time to discover a gap. Now, we get regular updates on the health of our detections and know when they break before something actually comes up. This gives peace of mind knowing that as we develop new detections, they won’t be broken and then forgotten.
Another benefit of WATCH is recording tactics, techniques, and procedures (TTPs) that were used by our red team in performing flash operations. Once we’ve implemented detections and conducted the retroactive analysis of a pentest operation, WATCH can be used to replay the TTPs used to validate these detections. In essence, WATCH makes detection atomic tests replayable TTPs.
Try WATCH
If you're running a SOC and relying on SIEM detections to catch threats, the question isn't whether your detections will break, it's whether you'll know when they do. You don't need a commercial BAS platform to start answering that question. A sandbox environment, a CI/CD pipeline, and a framework for scripting attack simulations can get you a long way.
You can try building your own detection testing framework by signing up for a free trial of GitLab Ultimate.
More to explore
View all blog posts
We want to hear from you
Enjoyed reading this blog post or have questions or feedback? Share your thoughts by creating a new topic in the GitLab community forum.
Share your feedback