Published on: May 7, 2020
4 min read
How application performance monitoring metrics helps developers
Automatically detect and monitor Kubernetes Clusters and deployed applications from the GitLab interface with application performance metrics (APM).


Application Performance Metrics, also referred to as GitLab Metrics, is designed for developers who need to understand the impact of the changes they are making on performance, and DevOps engineers/operators who are tasked with keeping the production systems up and running. GitLab Metrics, which is at viable maturity, can automatically detect and monitor Kubernetes clusters deployed via GitLab. The GitLab Metrics tool can also monitor all of your custom application metrics so that you can see how your entire system is behaving and performing without leaving the familiar GitLab interface.
GitLab has application performance monitoring tightly and automatically integrated into the DevOps process, which allows you to move seamlessly from development to production with confidence. GitLab Metrics is just one part of the GitLab Monitoring solution. When the whole suite of GitLab Monitoring tools is used together, we can help you decrease the frequency and severity of production incidents.
What’s under the hood?
GitLab Metrics is powered by Prometheus. Prometheus is quickly becoming the de facto standard for metrics for the cloud native community, because it rises to the top for monitoring Kubernetes and the available integrations cover the major elements of the cloud native ecosystem.
How to use GitLab Metrics?
GitLab Metrics can be used in two ways.
First, you can use Prometheus as a managed application within GitLab. Prometheus can be installed into your GitLab managed Kubernetes cluster with one click.
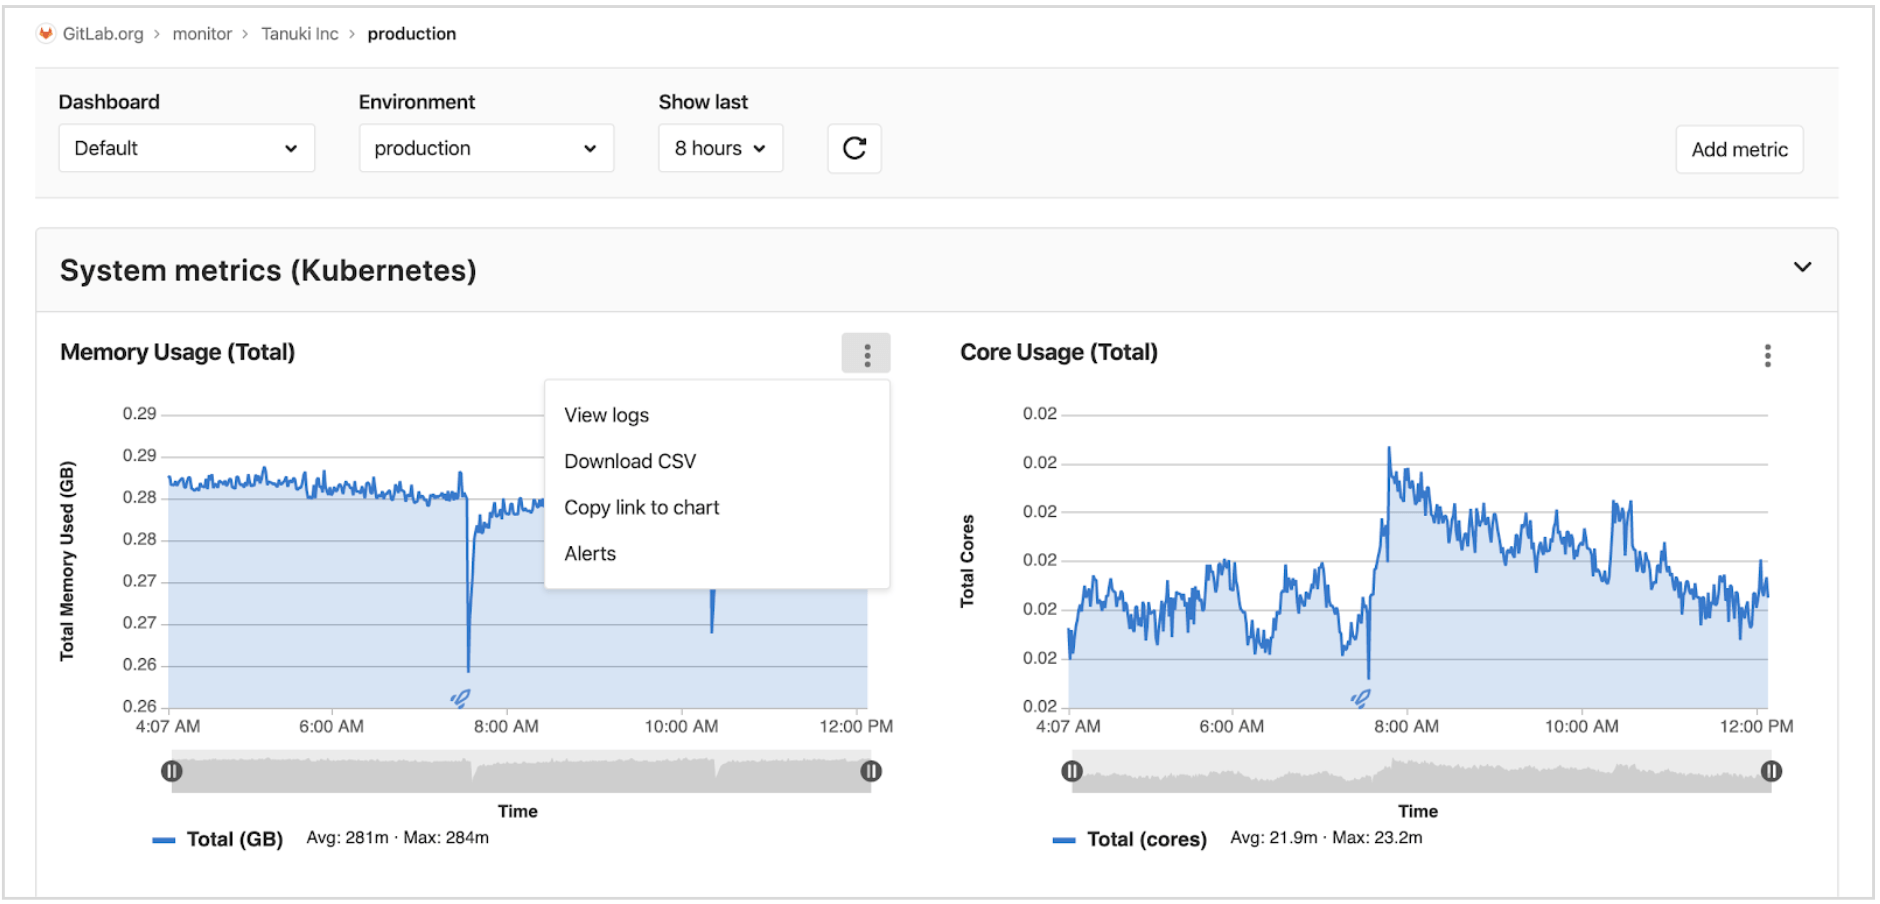 How the system metrics dashboard looks to users.
When integrated with Prometheus and Kubernetes, GitLab Metrics includes the following powerful capabilities:
- Default metrics collected from Prometheus, such as memory and core usage for the pod and canary deployment, Knative invocations, NGINX, AWS ELB, HA Proxy metrics, etc.
- Custom metrics can be configured with a promQL query.
- Alerts can be added on the UI directly for each metric.
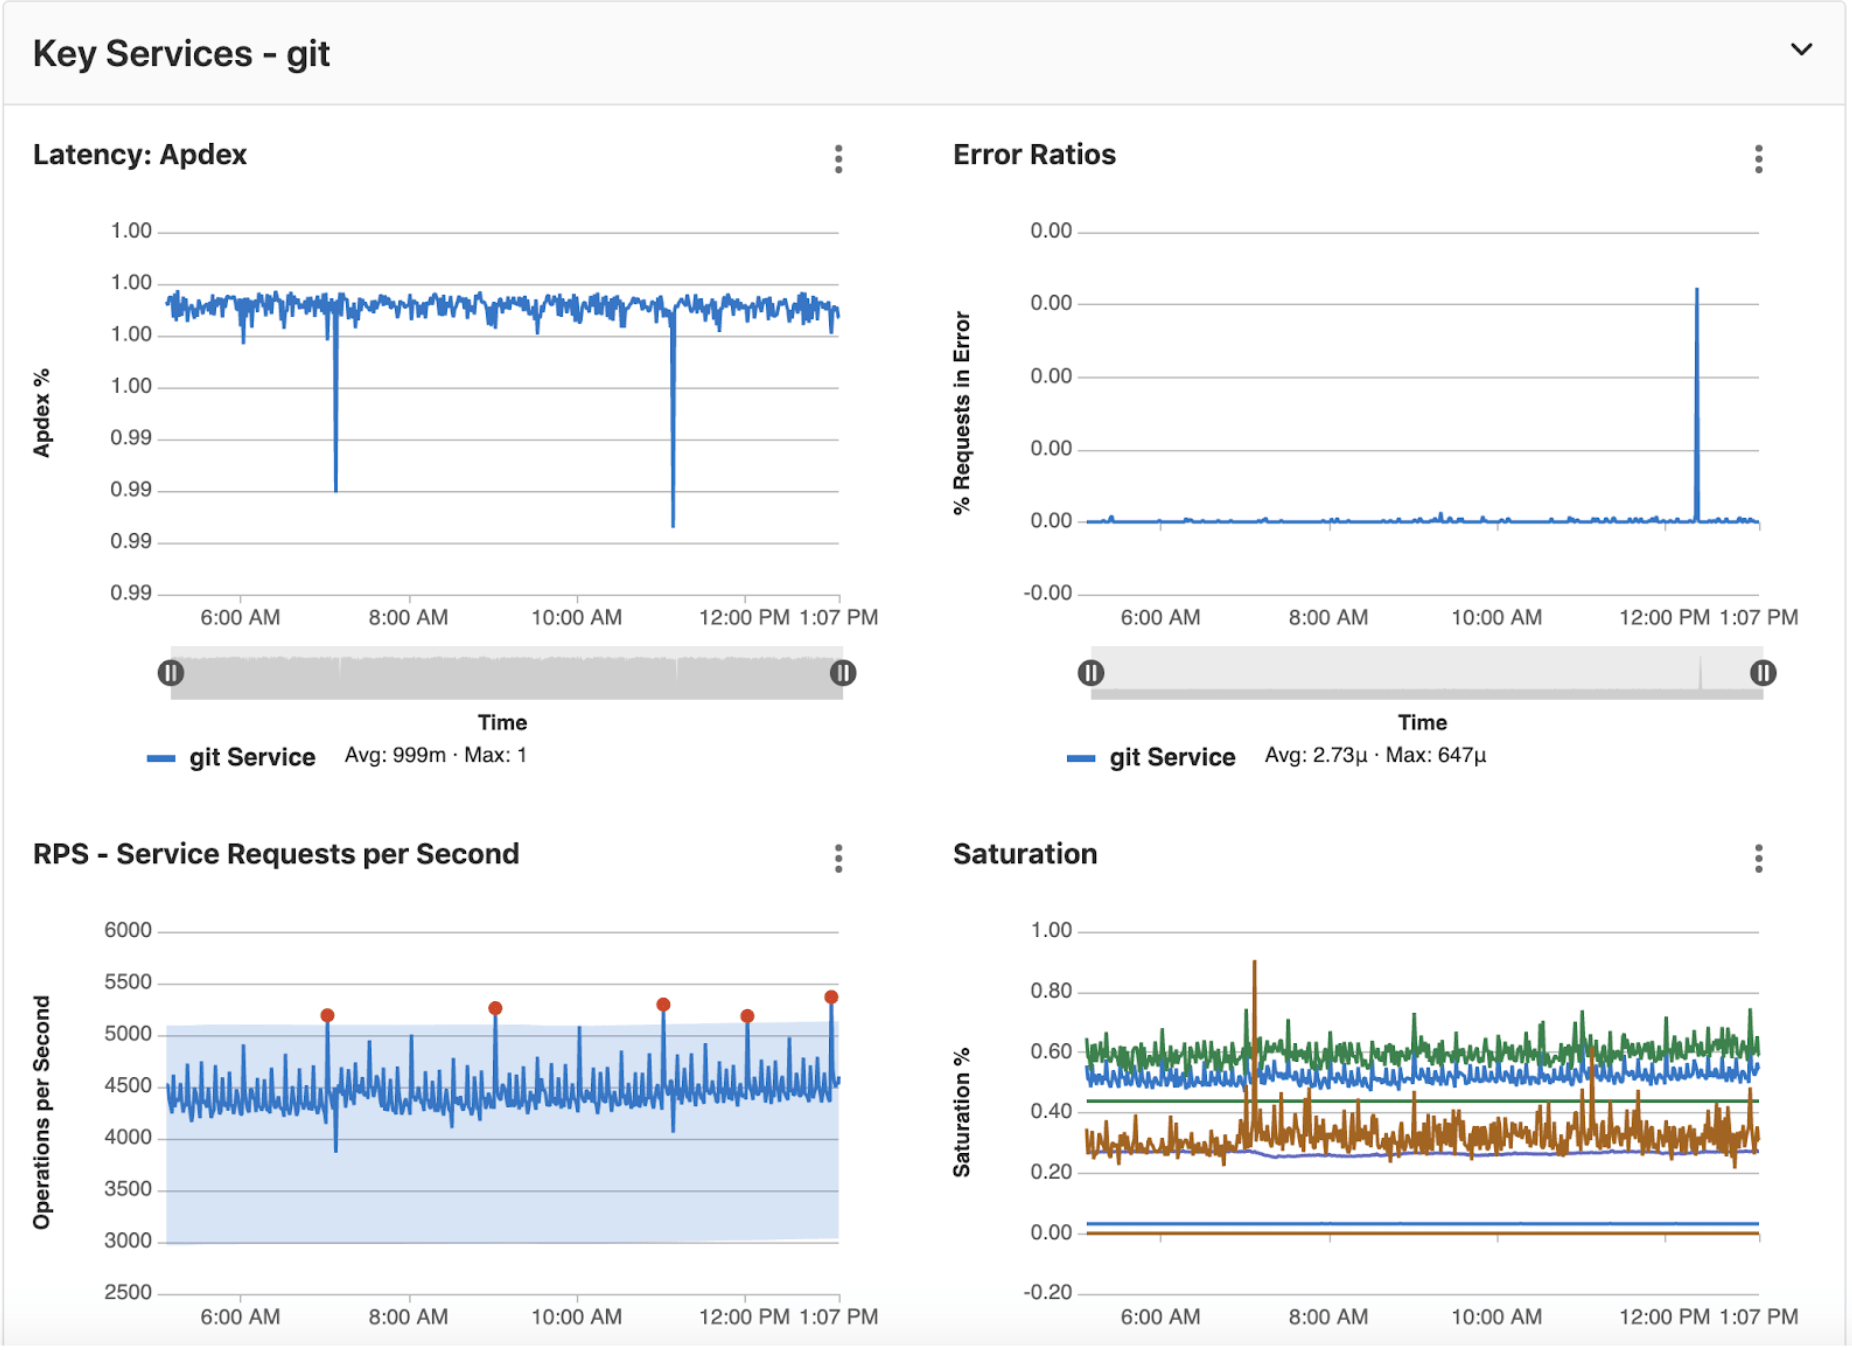
- Application deploys works by deploying to the monitored environment and can be visualized on the metrics chart itself to correlate performance spikes due to deploys.
- Custom dashboards can be configured as a YAML file and an existing GitLab default dashboard can be replicated as required.
 Use a YAML file to configure a customized Metrics dashboard.
If you already have an operational Prometheus instance that you would like to integrate with GitLab, you can simply point to the Prometheus server from within GitLab. In this case, performance metrics are retrieved from the external instance of Prometheus, and displayed within the GitLab interface.
How is GitLab dogfooding our metrics capability?
At GitLab, dogfooding is one of the main tenets of our results value.
The GitLab infrastructure team is used as an internal customer, and they provide feedback which feeds directly into how we develop our metrics capabilities. Prometheus and Grafana are two tools the GitLab infrastructure team uses. One of the main reasons the infrastructure team was reluctant to implement GitLab metrics was our previously inadequate graphing capabilities. To encourage our infrastructure team to dogfood metrics, we are focused on filling critical and non-critical gaps in GitLab metrics charts, which initiates a feedback loop for the product. Our goal is to eventually phase out Grafana and work exclusively with Prometheus and GitLab charts to monitor GitLab.com, we will do it on our GitLab way, iteratively, first we'll replace all of our publicly facing dashboard.
What's next for GitLab Metrics
Get started by visiting the GitLab Metrics documentation page and documentation. We’d love your help with prioritizing work on the most valuable improvements to the GitLab Metrics solution.
To report a bug or request a feature or enhancement, follow these steps:
- Open an issue in the GitLab project.
- Describe the feature enhancement and, if possible, include examples.
- Add these labels to the issue:
devops::monitor,Category::Metrics - Tag @dhershkovitch on the issue
Cover image by chuttersnap on Unsplash
More to explore
View all blog posts


We want to hear from you
Enjoyed reading this blog post or have questions or feedback? Share your thoughts by creating a new topic in the GitLab community forum.
Share your feedback