Published on: June 26, 2023
5 min read
GitLab's 3 steps to optimizing software value streams
Discover the power of GitLab Value Streams Dashboard (VSD) for optimizing software delivery workflows.

This is part three of our multipart series introducing you to the capabilities within GitLab Value Stream Management and the Value Streams Dashboard. In part one, learn about the Total Time Chart and how to simplify top-down optimization flow with Value Stream Management. In part two, learn how to get started with the Value Streams Dashboard.
It’s no news that software development is a complex process that involves many different stages, teams, and tools. With significant investments made in digital transformation and adopting new tools following the shift to remote work, measuring and managing the business value of the software development lifecycle (SDLC) have become more complex.
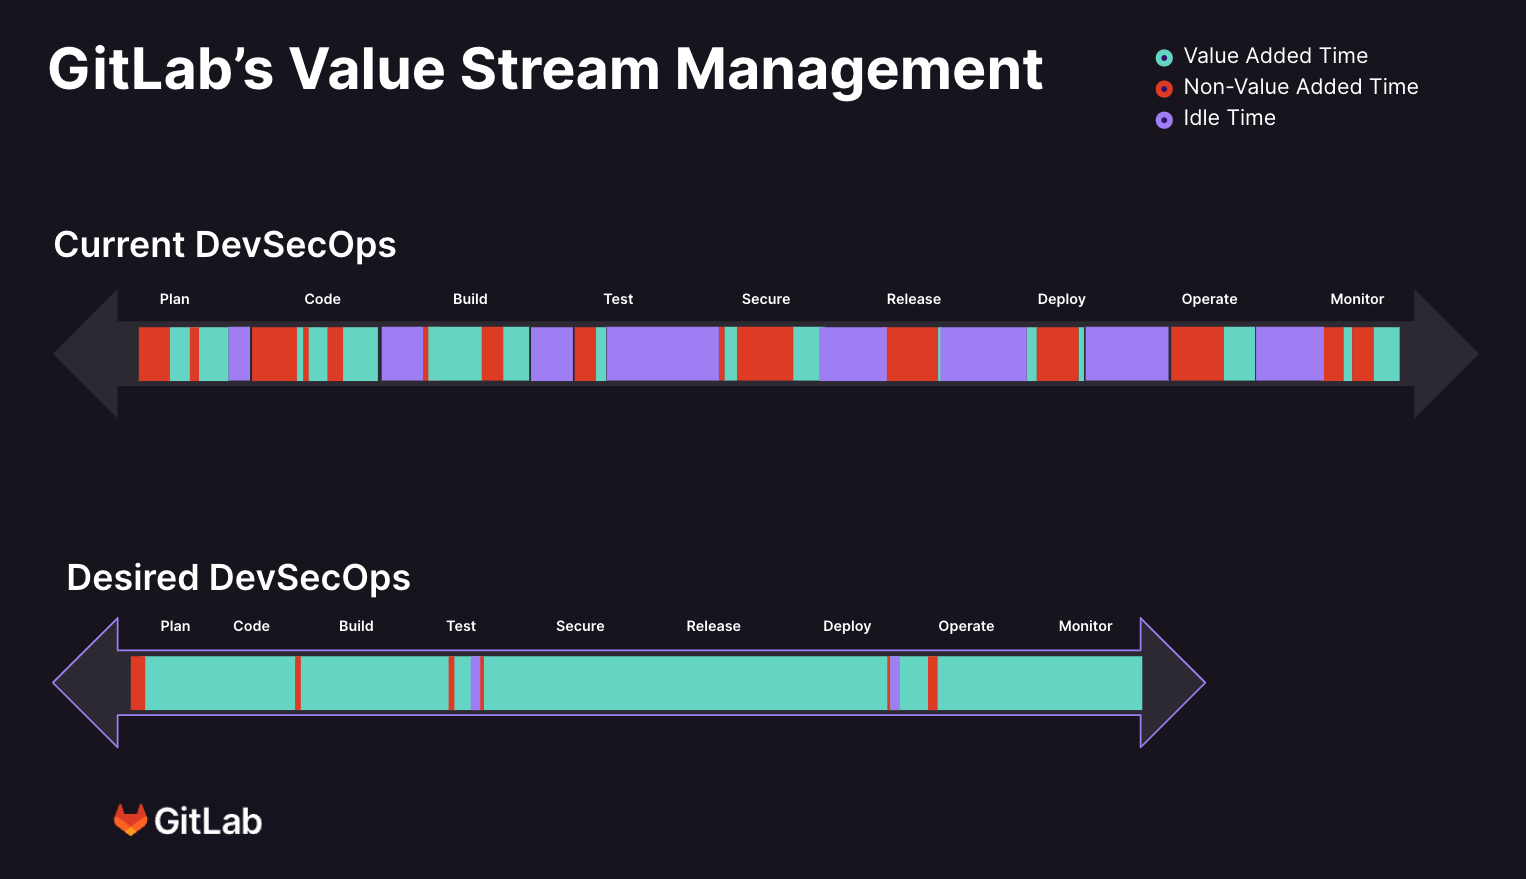
This is where Value Stream Management (VSM) comes in. VSM is a methodology that helps organizations optimize their software delivery process by visualizing, measuring, and improving the flow of value (a.k.a. the “value stream”) from ideation to production. Some examples are: the amount of time it takes to go from an idea to production, the velocity of the project, bottlenecks in the development process, and long-running issues or merge requests. As you’ve probably guessed from its title, this blog will cover how the new capabilities of GitLab Value Streams Dashboard can help you do all that, and optimize your software delivery.
Value Stream Management in a nutshell
GitLab VSM provides end-to-end visibility into your software delivery process. It enables you to map out your value stream, identify bottlenecks, measure key metrics, and identify the places where you are either lagging or doing exceptionally well. It then also allows you to take action on these insights. In essence, GitLab VSM helps you to understand and optimize your development processes to deliver software faster and better.
 With Value Stream Analytics, you can establish a baseline for measuring software delivery performance progress and identifying the touchpoints in the process that do not add value to the customer or your business.
And if you’re wondering how GitLab VSM is able to do that, it’s because GitLab provides an entire DevSecOps platform as a single application and, therefore, holds all the data needed to provide end-to-end visibility throughout the entire SDLC. So now, your decisions rely on actual data rather than blind estimation or gut feelings. Additionally, since GitLab is the place where work happens, these insights are also actionable, allowing your users to move from “understanding” to “fixing” at any time, from within their workflow and without losing context.
How VSM works: The three-step analysis
Let’s take a look at how GitLab VSM helps you optimize your SDLC in three easy steps:
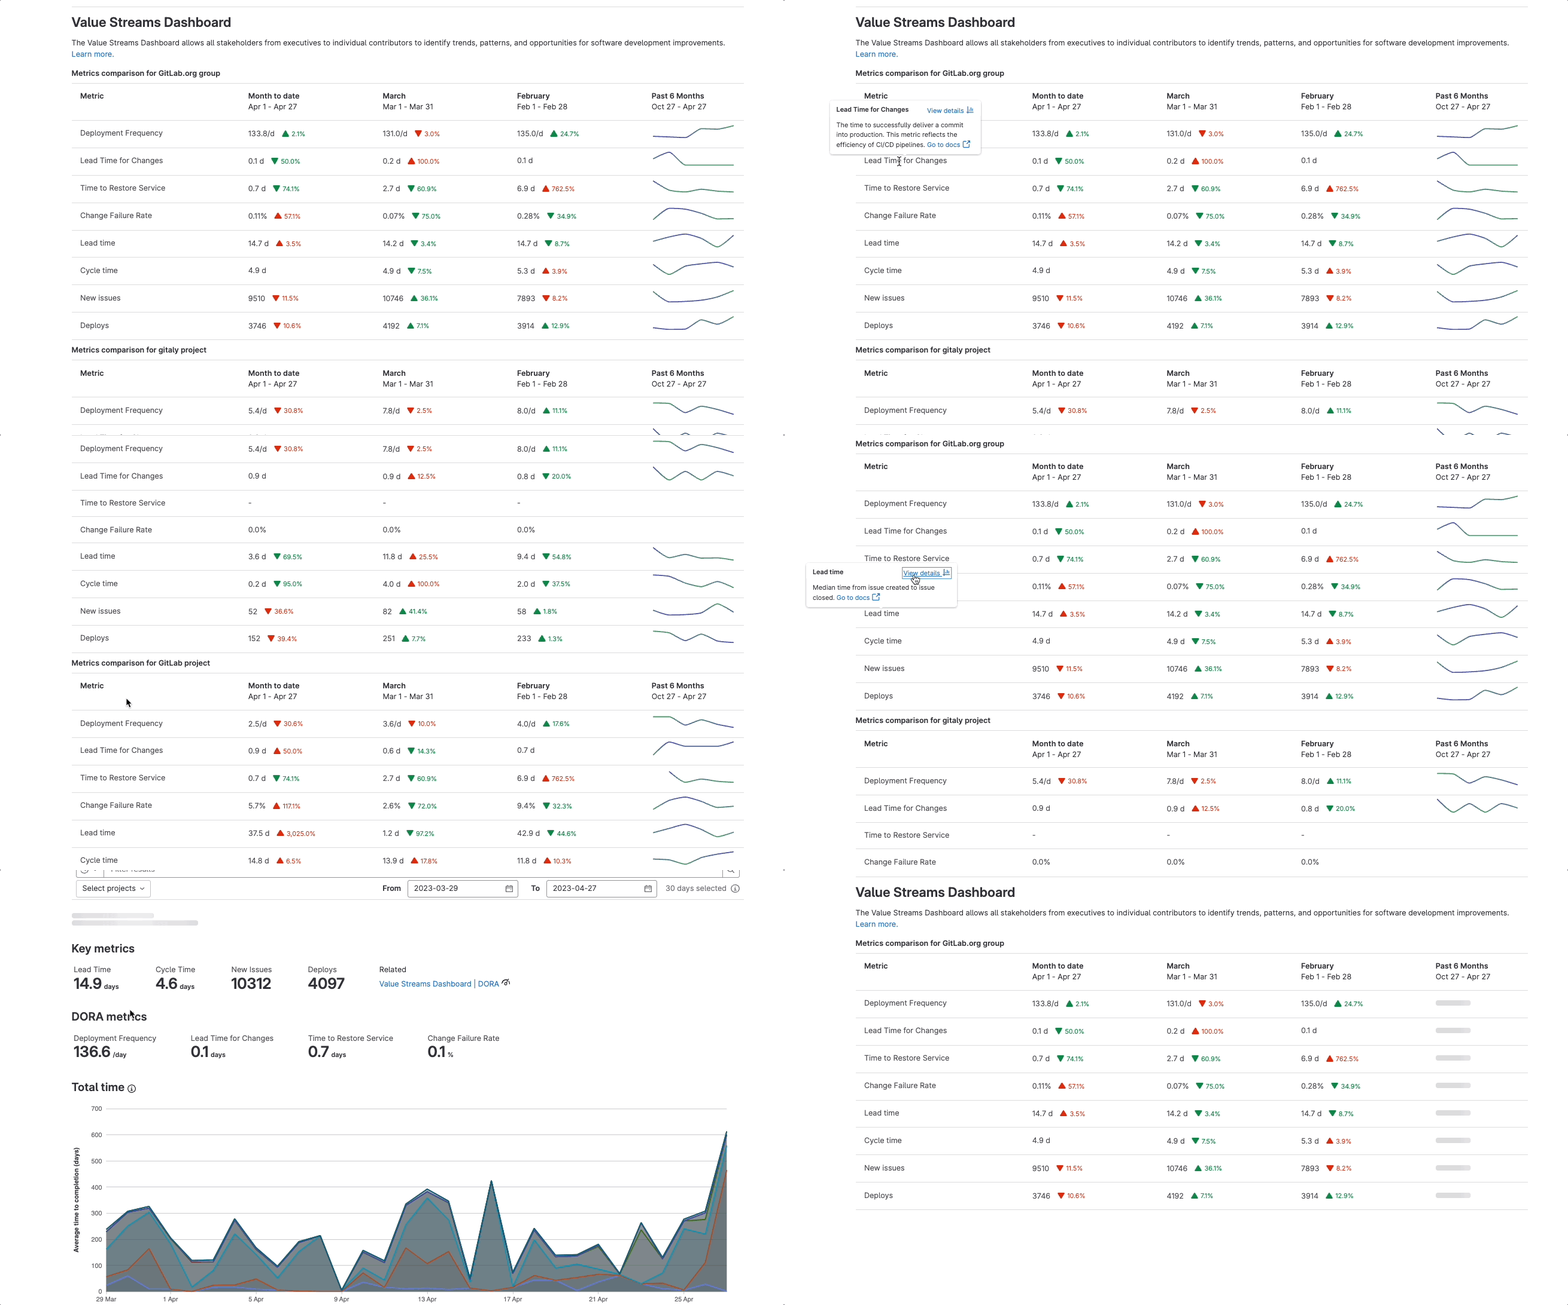
Step 1: Get an end-to-end view across your entire organization and pinpoint the value streams you need to focus on.
The Value Streams Dashboard is a centralized view where you can see and compare all of the SDLC metrics of all your organization's projects. This dashboard enables you to identify hotspots in your SDLC streams — projects or teams that are underperforming, with longer stages and cycle times. It also shows you where you have the largest value contributors, so you can identify and learn what is working well and what's not. With this information at hand, you can now prioritize your efforts and understand where to spend your time.

This centralized UI acts as a single source of truth for your organization, where all the relevant stakeholders can access, view, and analyze the same set of metrics. This ensures everyone is on the same page, promoting consistency in analysis and decision-making.
Read more: Getting started with the new GitLab Value Streams Dashboard
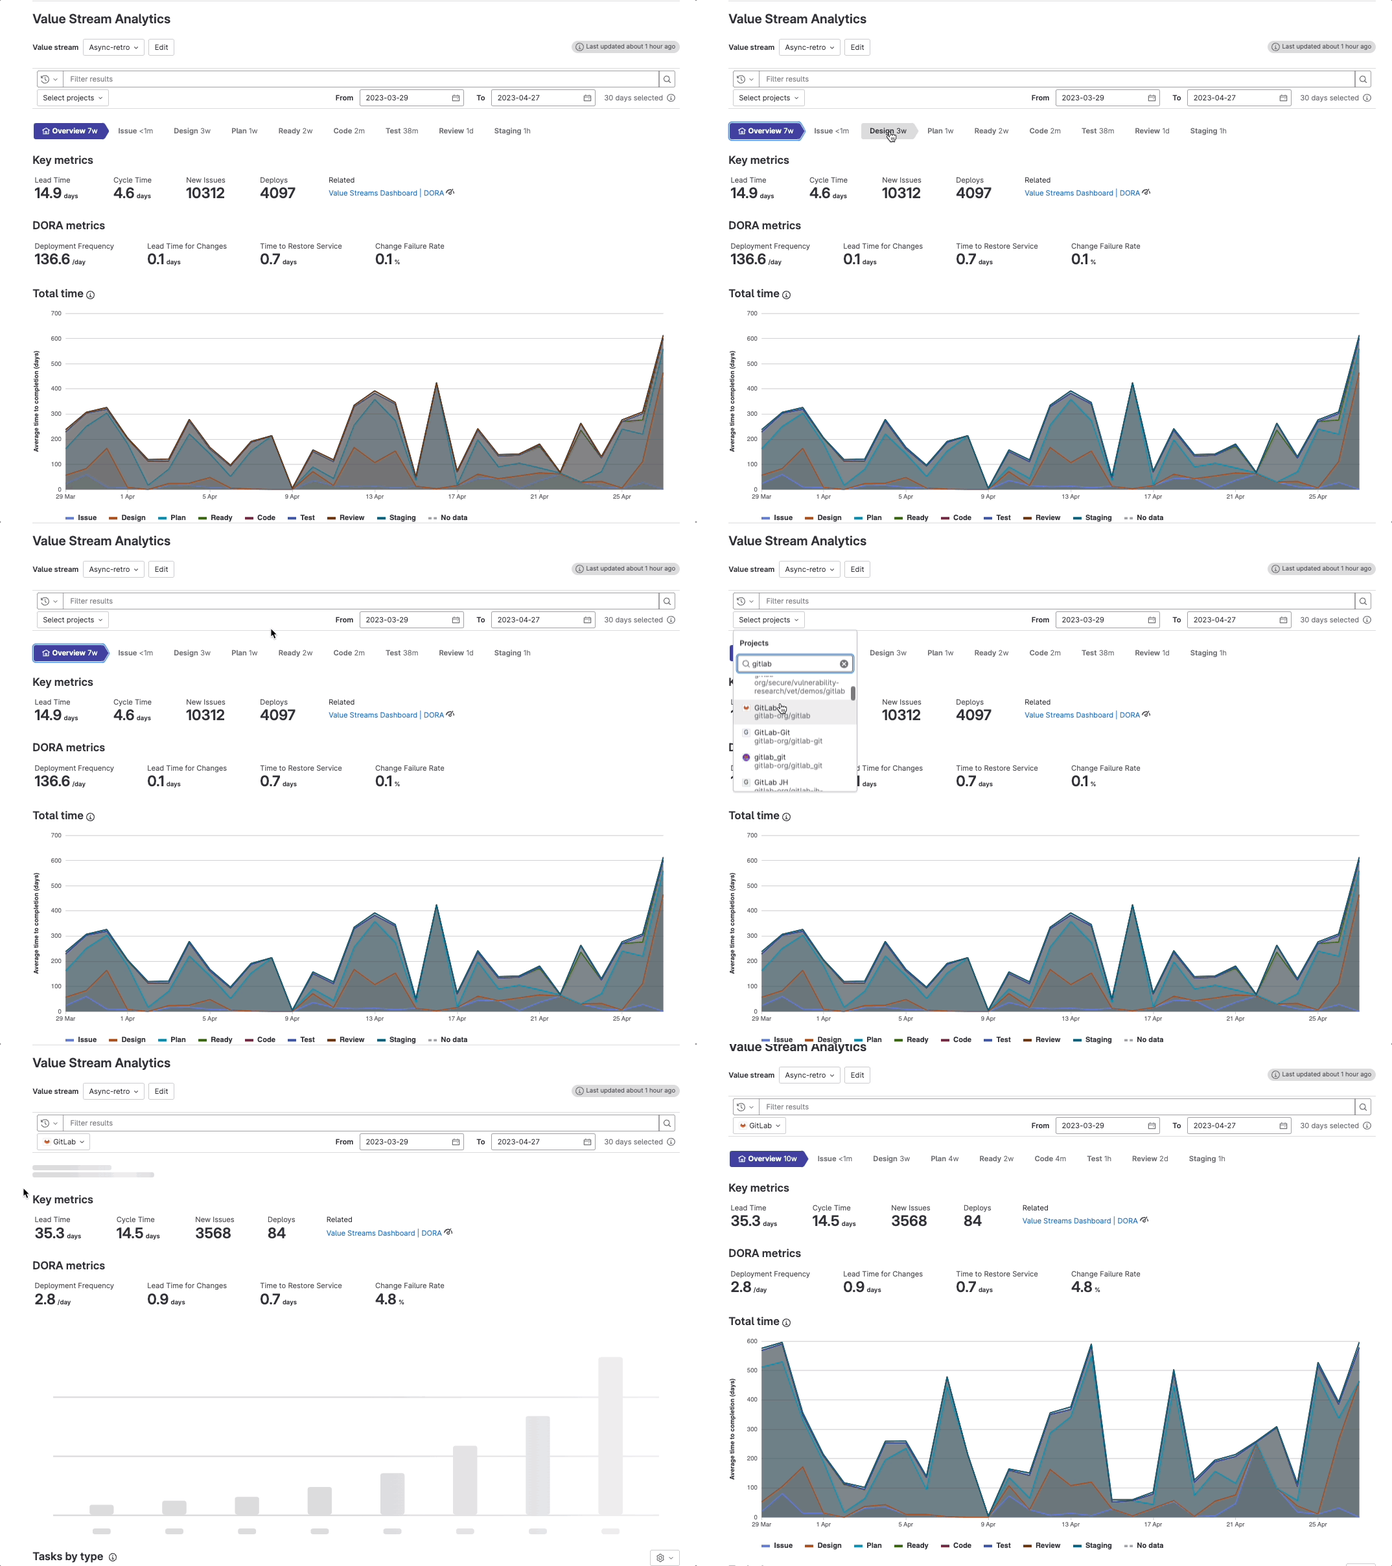
Step 2: Drill down into a specific project.
When you select a project from the main dashboard, you are directed to that project's Value Stream Analytics (VSA), where you see its value stream. The project's metrics are presented for each stage of the project, helping you understand where the main work lies and which stages need improvement. The VSA overview provides valuable insights into lead times, cycle times, and other critical metrics that help you identify areas for optimization.

Read more: Value stream management: Total Time Chart simplifies top-down optimization flow
Step 3: Dive deep into the Value Stream Analytics dashboard to analyze and fix issues.
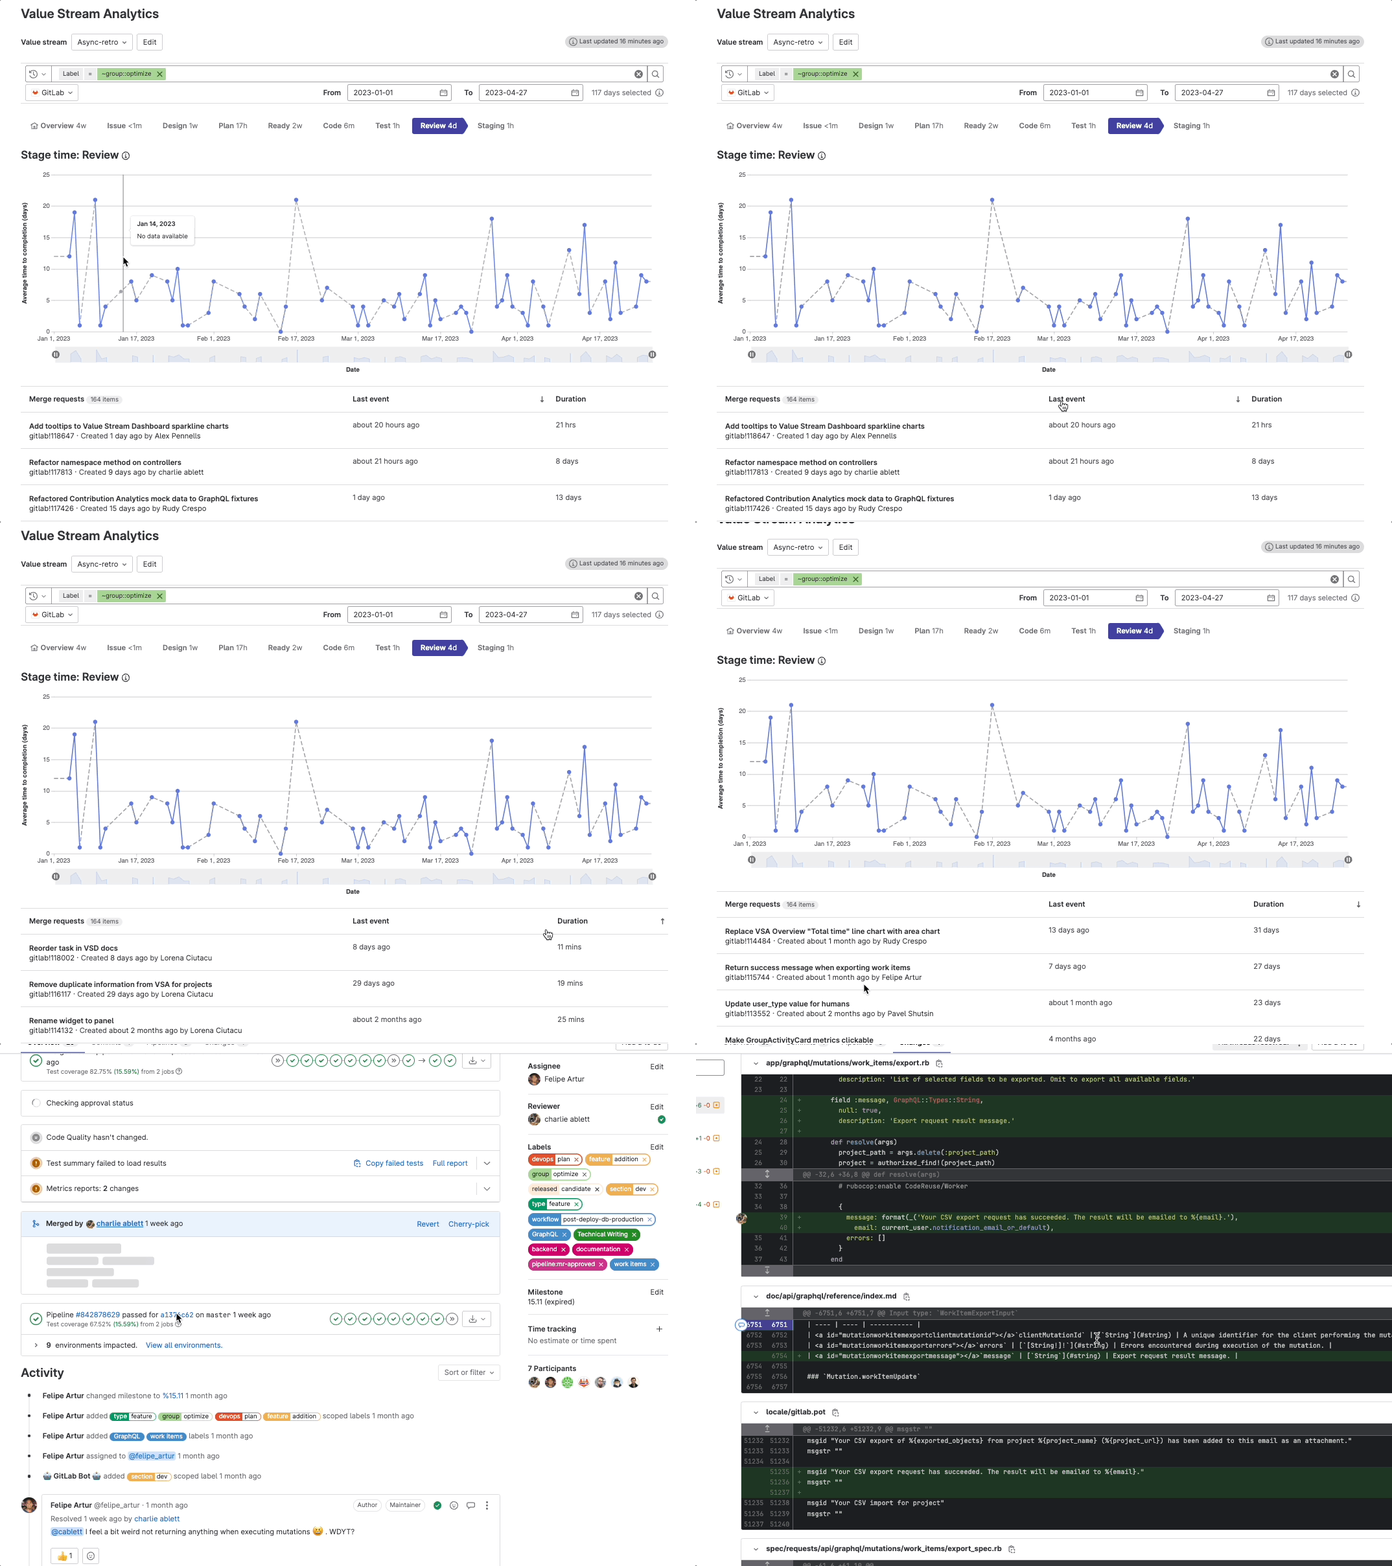
Once the main areas of interest are identified, GitLab Value Stream Analytics (VSA) enables you to drill down further into a specific stage of the project. In the stage table, you can sort the Last event column to view the most recent workflow event, and sort the items by duration so you can rearrange the events and gain insights faster. This way, you can easily detect work items that are slowing down the project in that stage. Here's an example how we dogfood VSA on gitlab-org.
You can identify the owner of the work items responsible for the delays, examine code changes, and perform a comprehensive analysis of the issue. This level of visibility and traceability empowers you to take targeted actions and make the necessary improvements to optimize the value stream, all within the context of your current workflow.
 Use GitLab Value Stream Management to visualize the progress of work from planning to value delivery, and gain actionable context.
The value of Value Stream Management
GitLab VSM is a powerful solution that fits seamlessly into your SDLC. By providing end-to-end visibility and granular, actionable insights into the value stream, VSM enables you to optimize your software delivery and provide value to your customers faster. Access the information you need, when you need it — and easily act on it from within your workplace. VSM offers you the best of both worlds: out-of-the-box functionality and the ability to customize features.
Say goodbye to time-consuming searches and hello to instant access to the information you need most. To learn more, check out the Value Stream Analytics documentation.
To help us improve the Value Stream Management, please share feedback about your experience in this survey.
We want to hear from you
Enjoyed reading this blog post or have questions or feedback? Share your thoughts by creating a new topic in the GitLab community forum.
Share your feedback
