Published on: June 13, 2024
7 min read
Monitor application performance with Distributed Tracing
Learn how Distributed Tracing helps troubleshoot application performance issues by providing end-to-end visibility and seamless collaboration across your organization.

Downtime due to application defects or performance issues can have devastating financial consequences for businesses. An hour of downtime is estimated to cost firms $301,000 or more, according to Information Technology Intelligence Consulting's 2022 Global Server Hardware and Server OS Reliability Survey. These issues often originate from human-introduced changes, such as code or configuration changes.
Resolving such incidents requires development and operations teams to collaborate closely, investigating the various components of the system to find the root cause change, and promptly restore the system back to normal operation. However, these teams commonly use separate tools to build, manage, and monitor their application services and infrastructure. This approach leads to siloed data, fragmented communication, and inefficient context switching, increasing the time spent to detect and resolve incidents.
GitLab aims to address this challenge by combining software delivery and monitoring functionalities within the same platform. Last year, we released Error Tracking as a general availability feature in GitLab 16.0. Now, we're excited to announce the Beta release of Distributed Tracing, the next step toward a comprehensive observability offering seamlessly integrated into the GitLab DevSecOps platform.
A new era of efficiency: GitLab Observability
GitLab Observability empowers development and operations teams to visualize and analyze errors, traces, logs, and metrics from their applications and infrastructure. By integrating application performance monitoring into existing software delivery workflows, context switching is minimized and productivity is increased, keeping teams focused and collaborative on a unified platform.
Additionally, GitLab Observability bridges the gap between development and operations by providing insights into application performance in production. This enhances transparency, information sharing, and communication between teams. Consequently, they can detect and resolve bugs and performance issues arising from new code or configuration changes sooner and more effectively, preventing those issues from escalating into major incidents that could negatively impact the business.
What is Distributed Tracing?
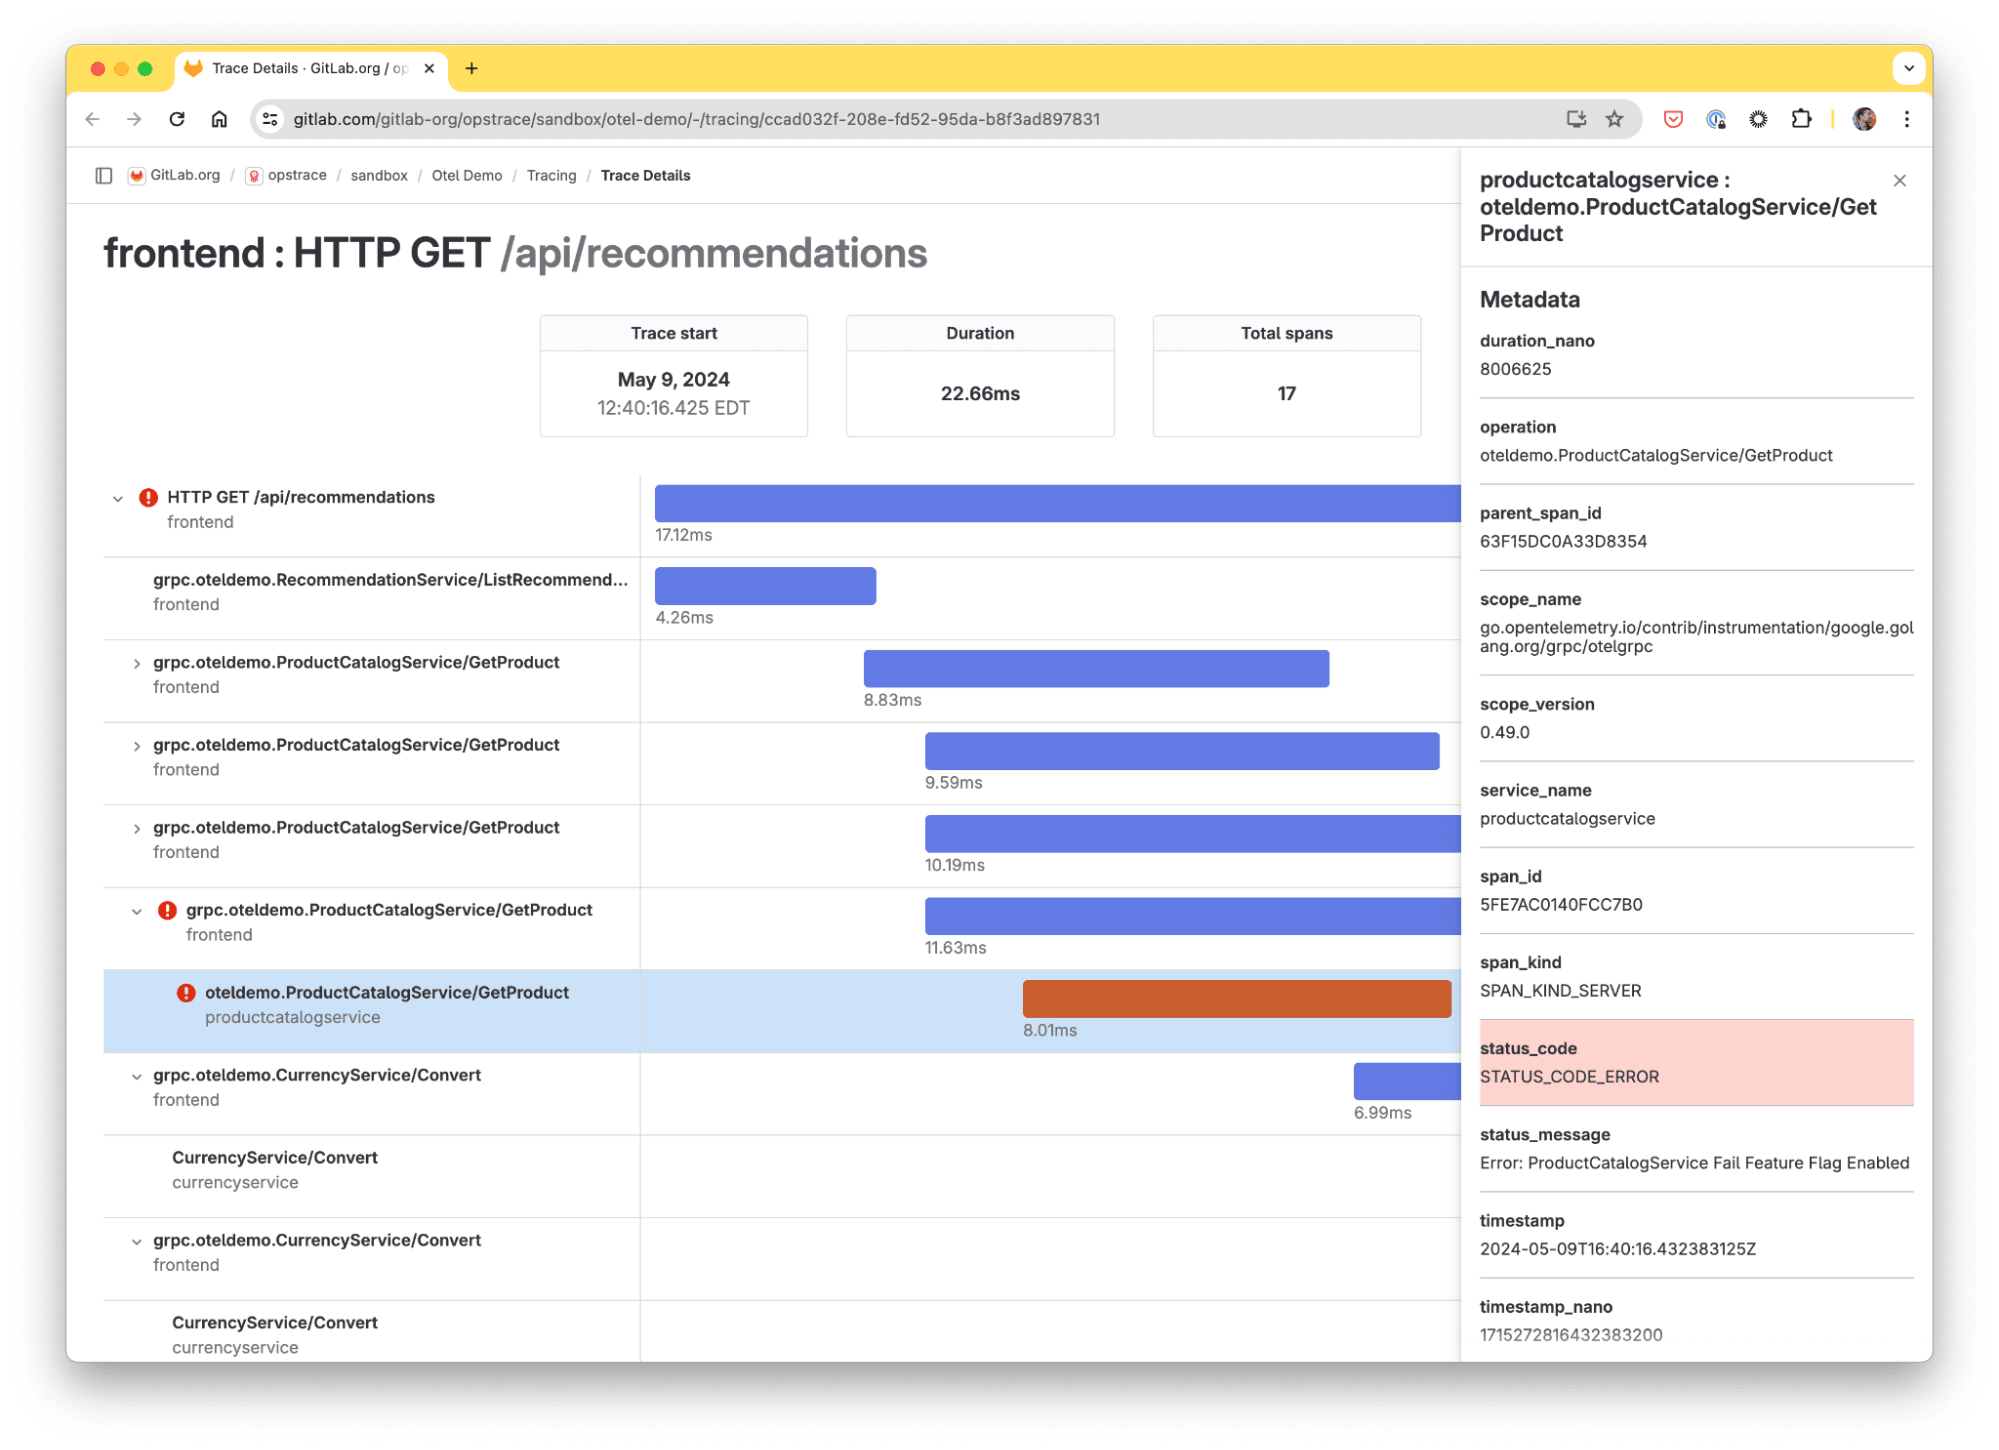
With Distributed Tracing, engineers can identify the source of application performance issues. A trace represents a single user request that moves through different services and systems. Engineers are able to analyze the timing of each operation and any errors as they occur.
Each trace is composed of one or more spans, which represent individual operations or units of work. Spans contain metadata like the name, timestamps, status, and relevant tags or logs. By examining the relationships between spans, developers can understand the request flow, identify performance bottlenecks, and pinpoint issues.
Distributed Tracing is especially valuable for microservices architecture, where a single request may involve numerous service calls across a complex system. Tracing provides visibility into this interaction, empowering teams to quickly diagnose and resolve problems.
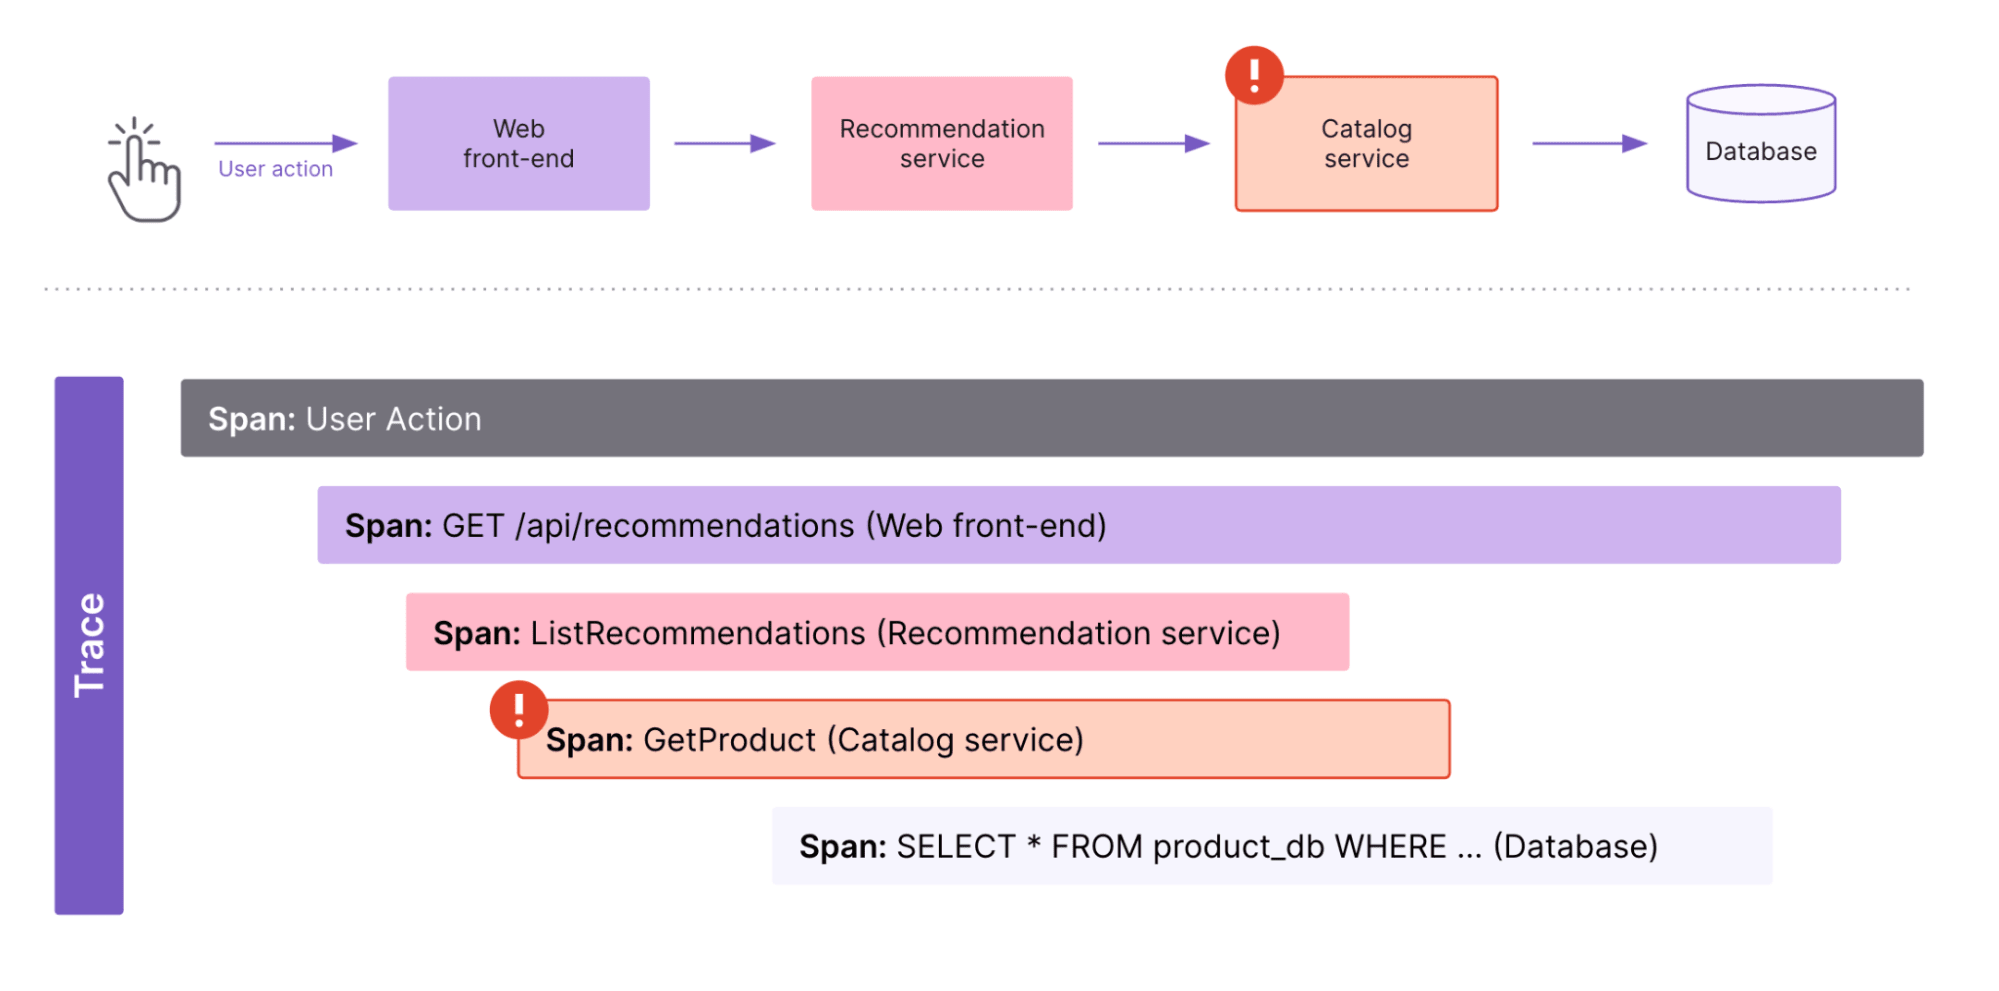
For example, this trace illustrates a how a user request flows through difference services to fetch product recommendations on a e-commerce website:
User Action: This indicates the user's initial action, such as clicking a button to request product recommendations on a product page.Web front-end: The web front-end sends a request to the recommendation service to retrieve product recommendations.Recommendation service: The request from the web front-end is handled by the recommendation service, which processes the request to generate a list of recommended products.Catalog service: The recommendation service calls the catalog service to fetch details of the recommended products. An alert icon suggests an issue or delay at this stage, such as a slow response or error in fetching product details.Database: The catalog service queries the database to retrieve the actual product details. This span shows the SQL query in the database.
By visualizing this end-to-end trace, developers can identify performance issues – here, an error in the Catalog service – and quickly diagnose and resolve issues across the distributed system.
How Distributed Tracing works
Here is a breakdown of how Distributed Tracing works.
Collect data from any application with OpenTelemetry
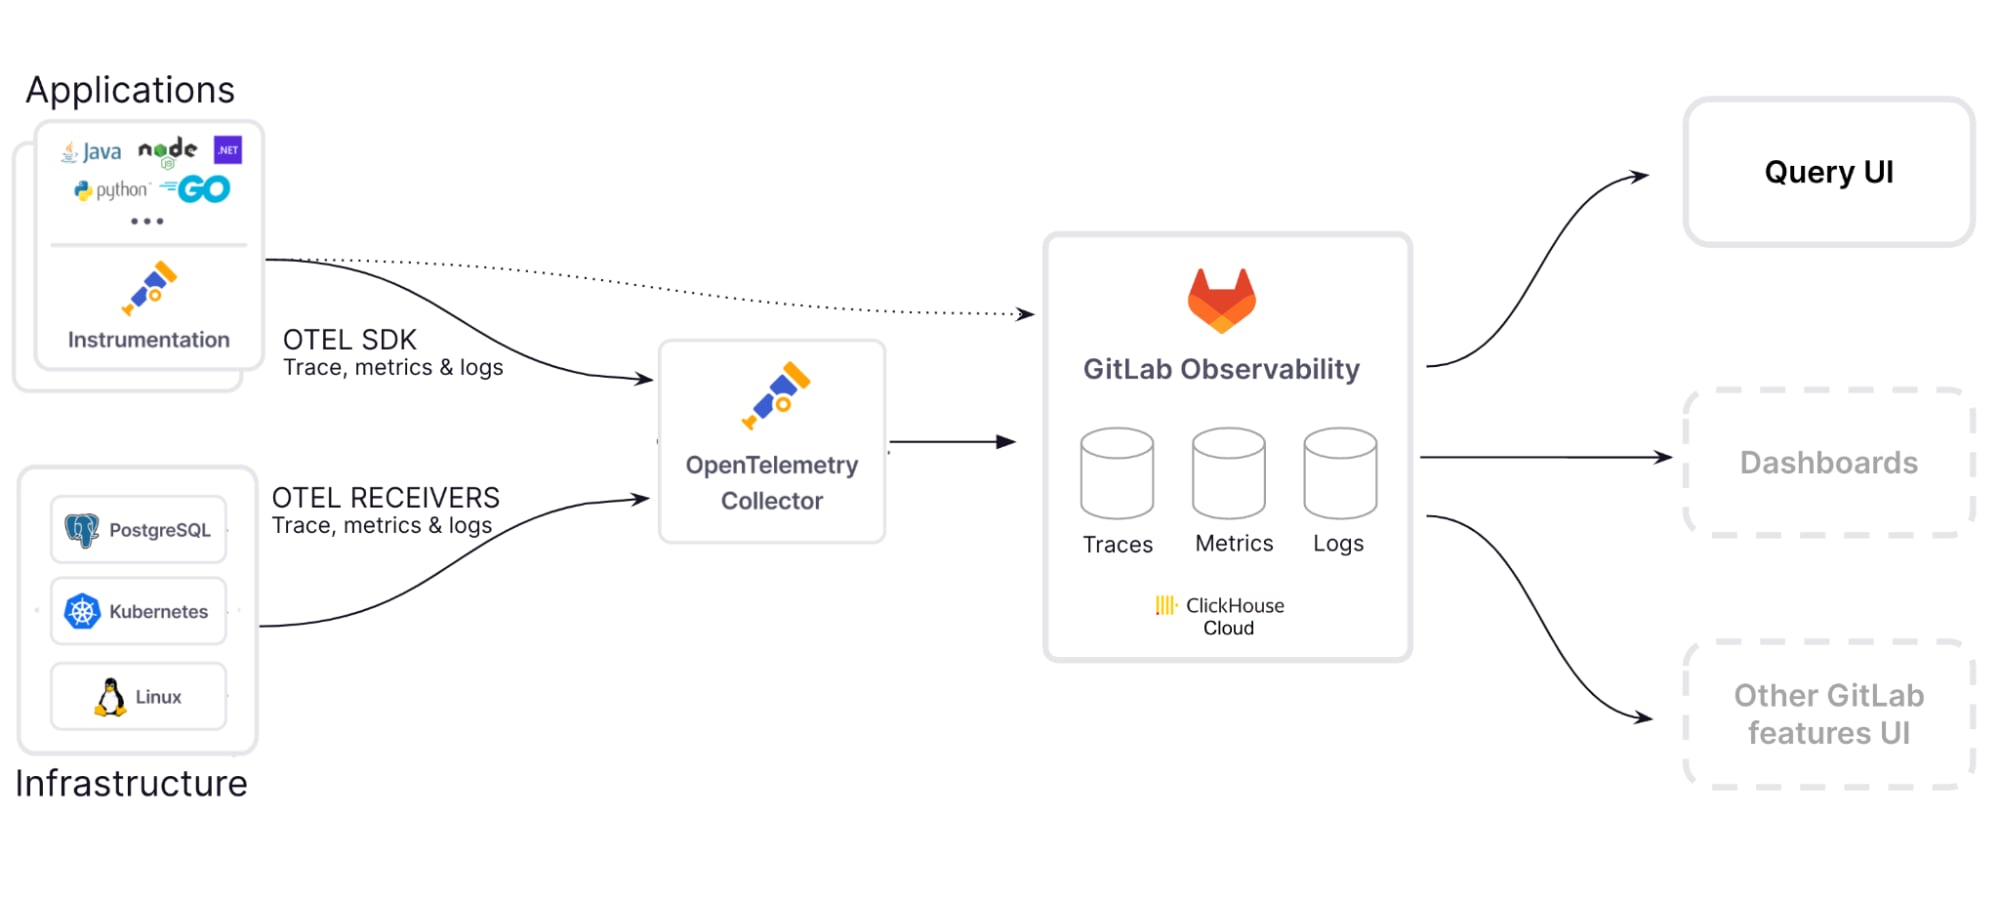
Traces and spans can be collected using OpenTelemetry, an open-source observability framework that supports a wide array of SDKs and libraries across major programming languages and frameworks. This framework offers a vendor-neutral approach for collecting and exporting telemetry data, enabling developers to avoid vendor lock-in and choose the tools that best fit their needs.
This means that if you are already using OpenTelemetry with another vendor, you can send data to us simply by adding our endpoint to your configuration file, making it very easy to try out our features!
Ingest and retain data at scale with fast, real-time queries
Observability requires the storage and querying of vast amounts of data while maintaining low latency for real-time analytics. To meet these needs, we developed a horizontally scalable, long-term storage solution using ClickHouse and Kubernetes, based on our acquisition of Opstrace. This open-source platform ensures rapid query performance and enterprise-grade scalability, all while minimizing costs.
Explore and analyze traces effortlessly
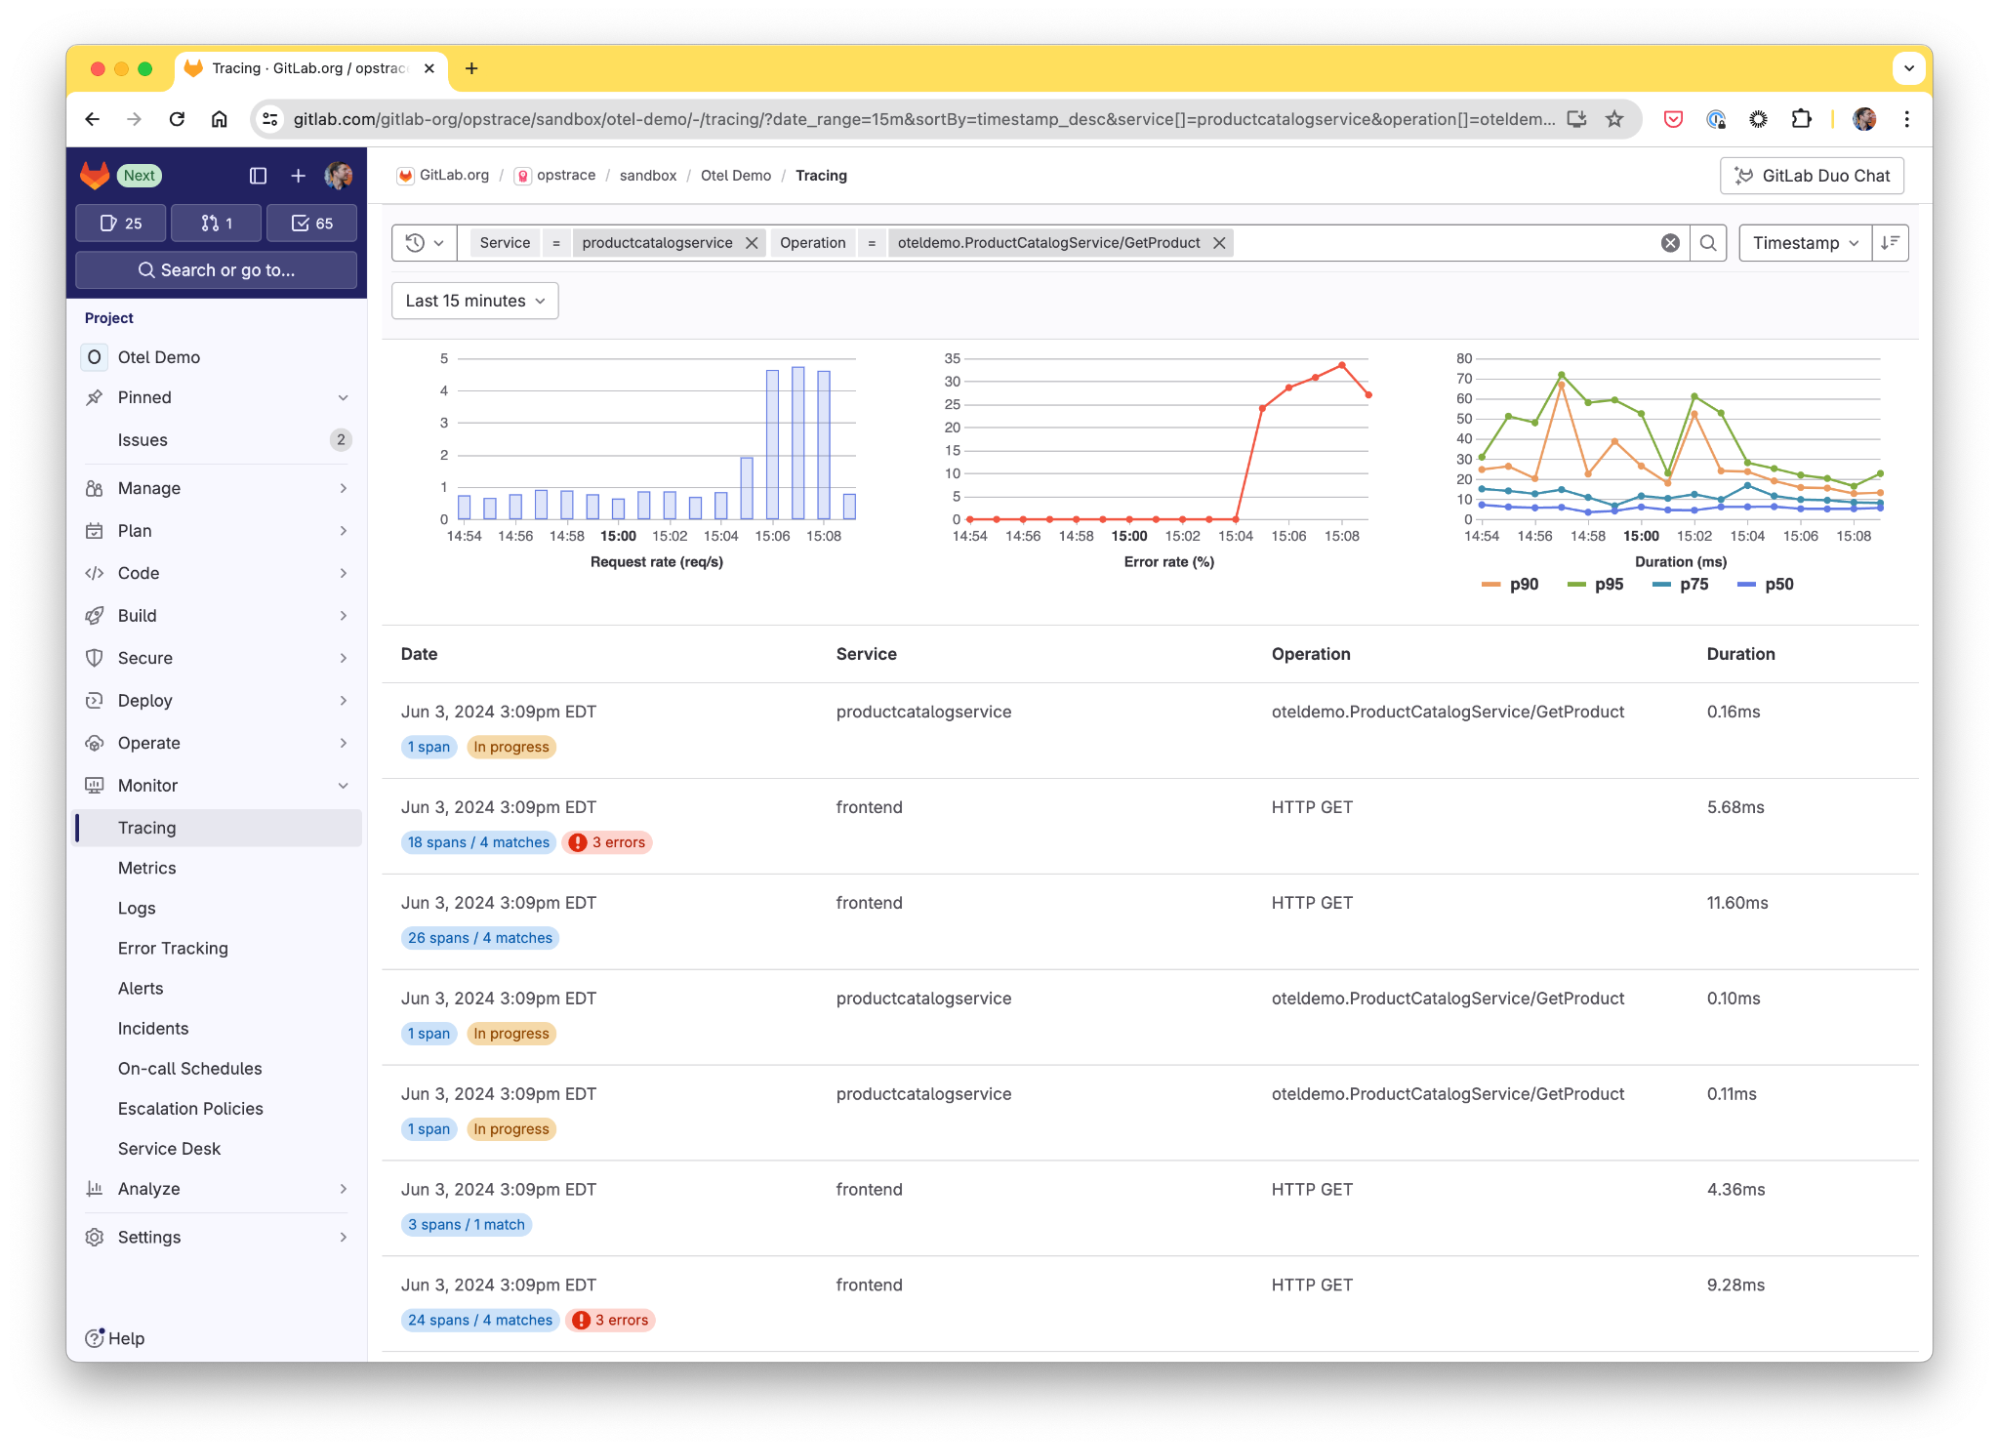
An advanced, native-level user interface is crucial for effective data exploration. We built such an interface from the ground up, starting with our Trace Explorer, which allows users to examine traces and understand their application's performance:
- Advanced filtering: Filter by services, operation names, status, and time range. Autocomplete helps simplify querying.
- Error highlighting: Easily identify error spans in search results.
- RED metrics: Visualize the Requests rate, Errors rate, and average Duration as a time-series chart for any search in real-time.
- Timeline view: Individual traces are displayed as a waterfall diagram, providing a complete view of a request distributed across different services and operations.
- Historical data: Users can query traces up to 30 days in the past.
How we use Distributed Tracing at GitLab
Dogfooding is a core value and practice at GitLab. We've been already using early versions of Distributed Tracing for our engineering and operations needs. Here are a couple example use cases from our teams:
1. Debug errors and performance Issues in GitLab Agent for Kubernetes
The Environments group has been using Distributed Tracing to troubleshoot and resolve issues with the GitLab Agent for Kubernetes, such as timeouts or high latency issues. The Trace List and Trace Timeline views offer valuable insights for the team to address these concerns efficiently. These traces are shared and discussed in the related GitLab issues, where the team collaborates on resolution.
2. Optimize GitLab’s build pipeline duration by identifying performance bottlenecks
Slow deployments of GitLab source code can significantly impact the productivity of the whole company, as well as our compute spending. Our main repository runs over 100,000 pipelines every month. If the time it takes for these pipelines to run changes by just one minute, it can add or remove more than 2,000 hours of work time. That's 87 extra days!
To optimize pipeline execution time, GitLab's platform engineering teams utilize a custom-built tool that converts GitLab deployment pipelines into traces.
The Trace Timeline view allows them to visualize the detailed execution timeline of complex pipelines and pinpoint which jobs are part of the critical path and slowing down the entire process. By identifying these bottlenecks, they can optimize job execution – for example, making the job fail faster, or running more jobs in parallel – to improve overall pipeline efficiency.
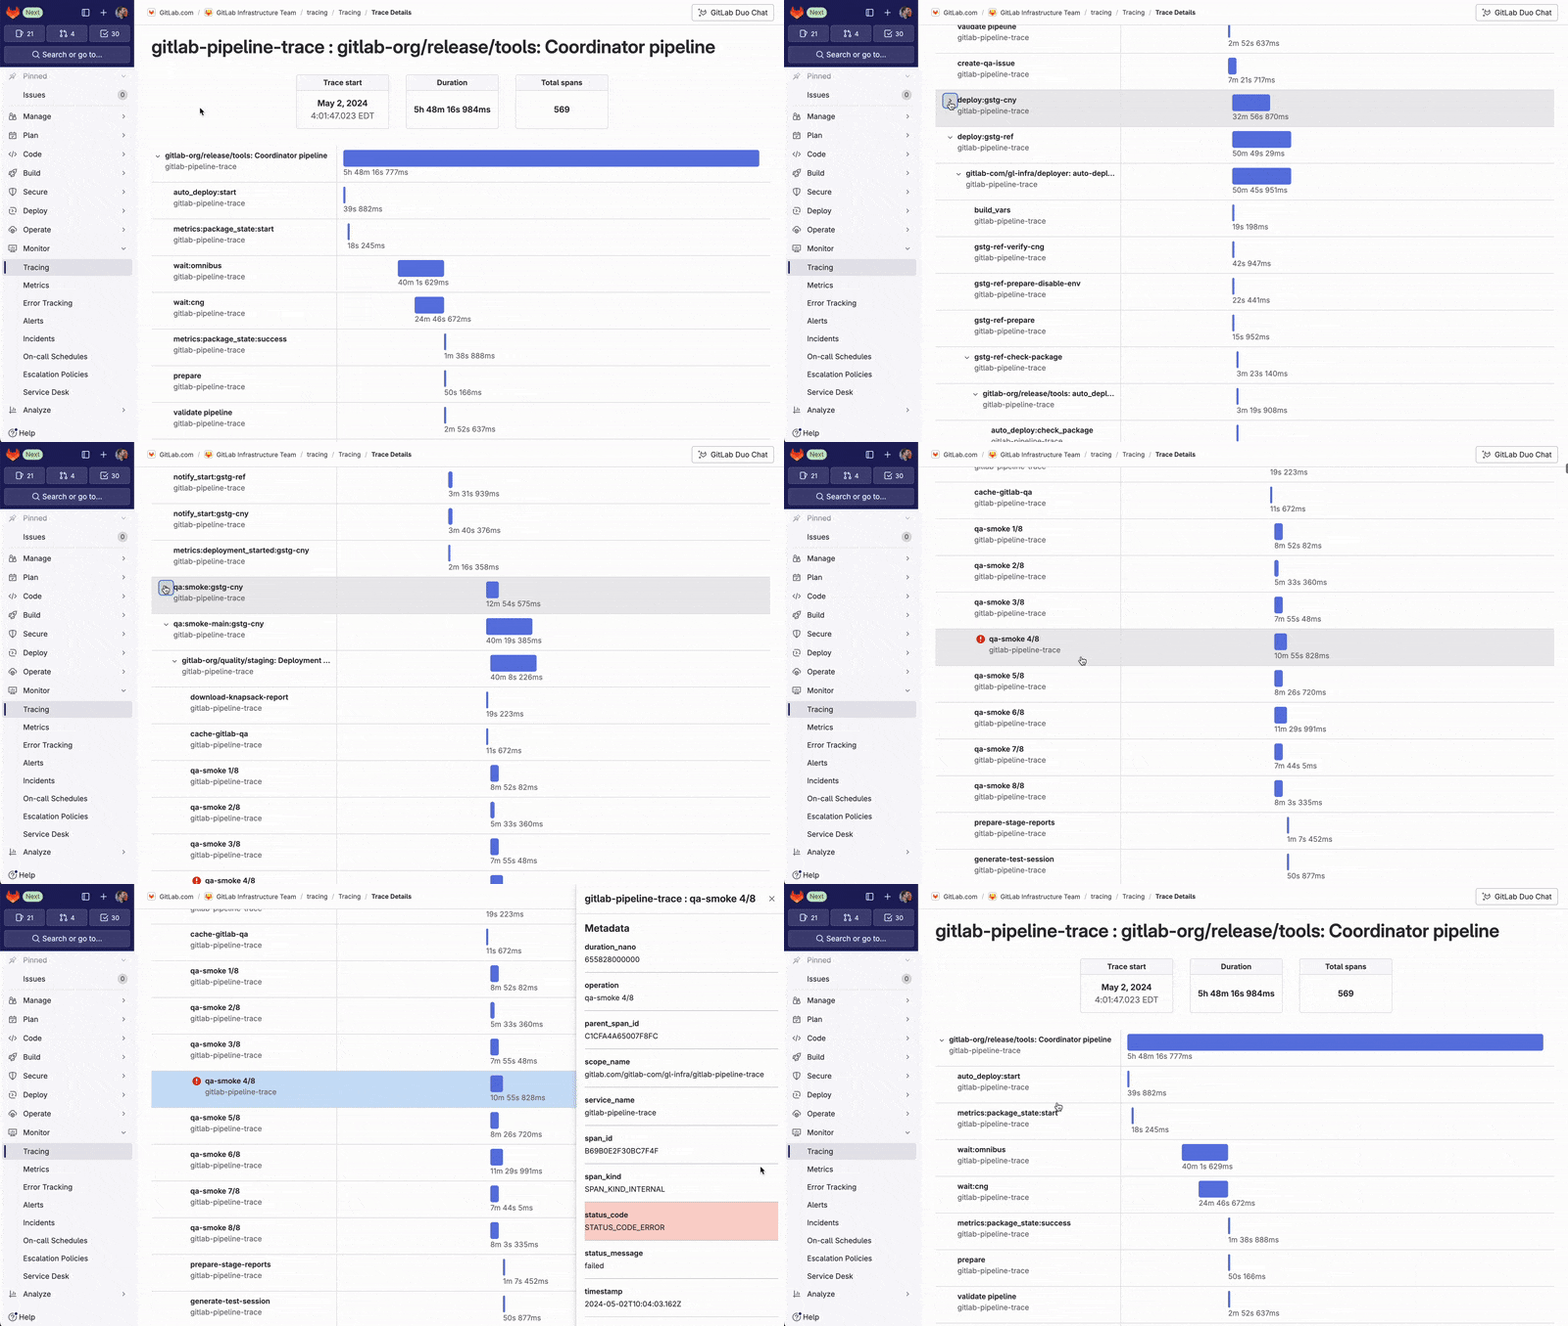
The script is freely available, so you can adapt it for your own pipelines.
What's coming next?
This release is just the start: In the next few months, we'll continue to expand our observability and monitoring features with the upcoming Metrics and Logging releases. Check out our Observability direction page for more info, and keep an eye out for updates!
Join the private Beta
Interested in being part of this exciting journey? Sign up to enroll in the private Beta and try out our features. Your contribution can help shape the future of observability within GitLab, ensuring our tools are perfectly aligned with your needs and challenges.
Help shape the future of GitLab Observability. Join the Distributed Tracing Beta.
We want to hear from you
Enjoyed reading this blog post or have questions or feedback? Share your thoughts by creating a new topic in the GitLab community forum.
Share your feedback