A continuous journey needs continuous improvement
DORA Metrics
Accelerating DevOps with DORA Metrics and Value Stream Analytics Management.

Trusted by:


DevOps maturity and benchmarks.
After eight years of data collection and research, DORA's Accelerate State of DevOps research program has developed and validated four elements that measure software delivery velocity and a fifth one for stability: (1) deployment frequency, (2) lead time for changes, (3) mean time to restore and (4) change failure rate and (5) reliability. The outcomes from the report help teams measure and improve their DevOps performance. GitLab offers out-of-the- box DORA metrics visibility for teams to measure current state, deliver visibility across the value chain, streamline with business objectives, and promote a collaborative culture
Track and manage the flow of software development
Accurate out-of-the-box DORA metrics to benchmark your engineering teams.

Why GitLab for DORA?
DORA Custom Reporting
DORA Insights allows users to create custom reports to explore data and track metrics improvements, understand patterns in their metrics trends, and compare performance between groups and projects.
DORA Metrics API
GitLab enables retrieval and usage of the DORA metrics data via GraphQL and REST APIs for analytics and reporting best suited for your team. You can empower your business teams to utilize metrics data through APIs, without technical barriers.
Optimize engineering velocity
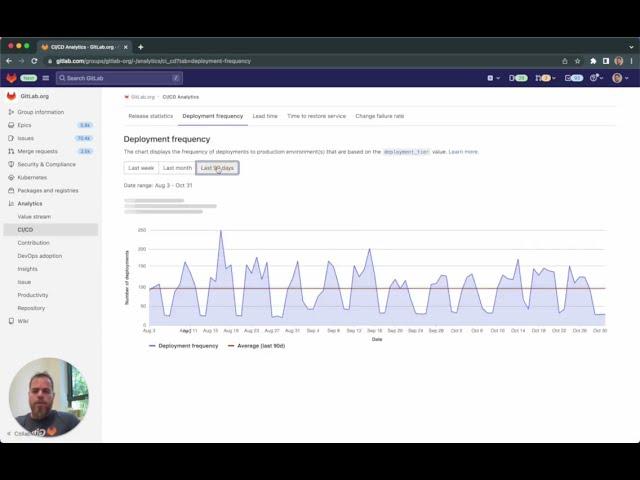
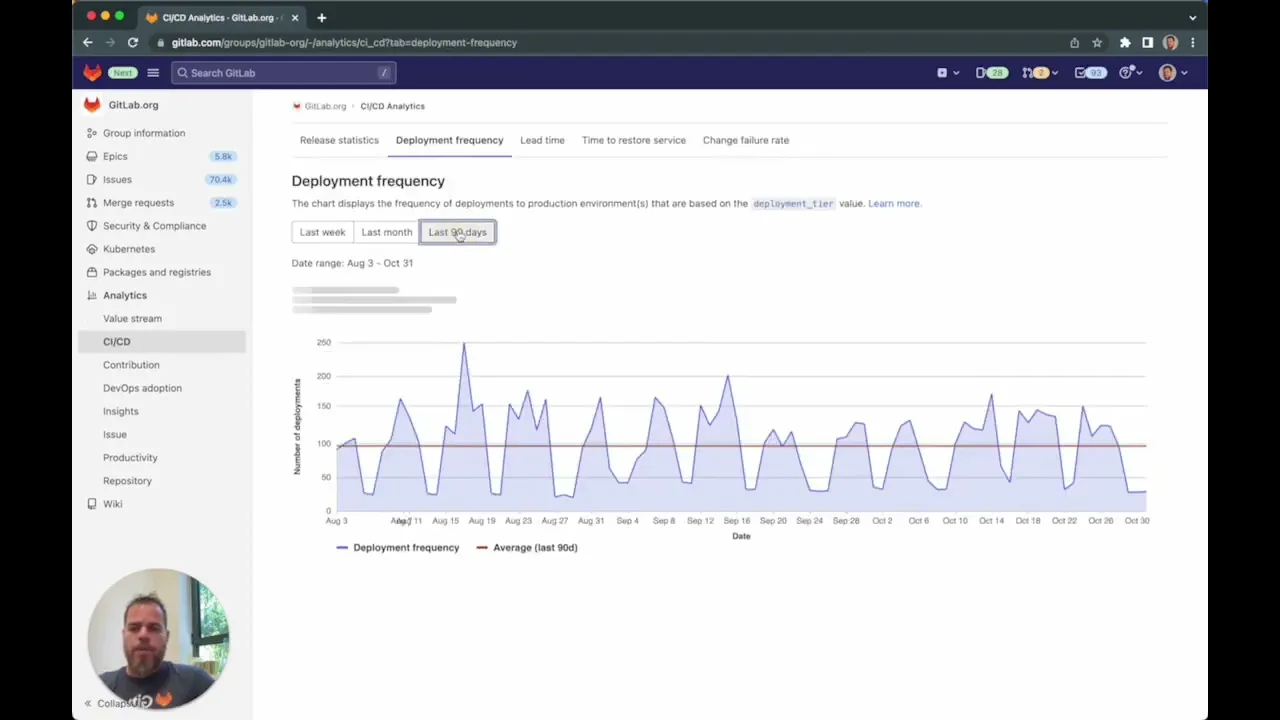
Deployment Frequency
The number of times code or software is deployed to production or “shipped”. You can evaluate the needs of the business and ensure that the velocity matches business needs.
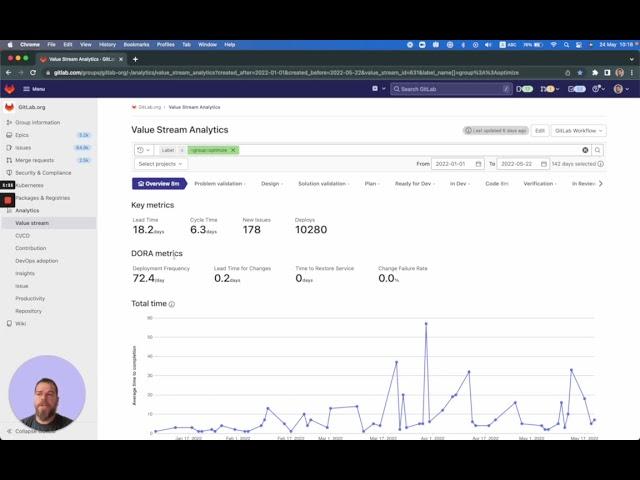
Insights driven through Value Stream Analytics
- Scope for automation to improve processes
- Benchmark against target business goals
Lead time for change
The time from when development teams start working on a feature to the time the feature gets deployed. Understanding the pace of delivery and aiming for smaller, frequent deployments can help you get quicker feedback.
Insights driven through Value Stream Analytics
- Breakdown release process based on time spent in different tasks
- Identify and fix bottlenecks in release process leading to delays
Time to Restore Service
The time it takes to restore a failure in production, where a failure can be an unplanned outage or a service failure. Service failures and outages can be of different types and severity, which can make it tricky to measure.
Insights driven through Value Stream Analytics
- Shift-left opportunities to minimize service failure and related impacts
- Drill down to the specific apps which respond poorly to failure/outages
Change failure rate
The percentage of deployment causing a failure in production. It is the measure of the number of times “a hotfix, a rollback, a fix-forward, or a patch” is required after a deployment. You can assess code quality, and testing procedures to understand failure rates.
Insights driven through Value Stream Analytics
- Deeper understanding of risk factors resulting in failure
- Process inefficiencies to address to minimize risks
Companies deriving value from DORA metrics with Value Stream Analytics
Companies deriving value from DORA metrics with Value Stream Analytics
Slide 1 of 5

Without GitLab, we wouldn’t be able to measure them. So this would be the key point, and that’s also why I really like the way the API is designed. There’s a lot more that we can be doing with just the API, because without that, we wouldn’t be able to measure all of that stuff, because we wouldn’t know.